
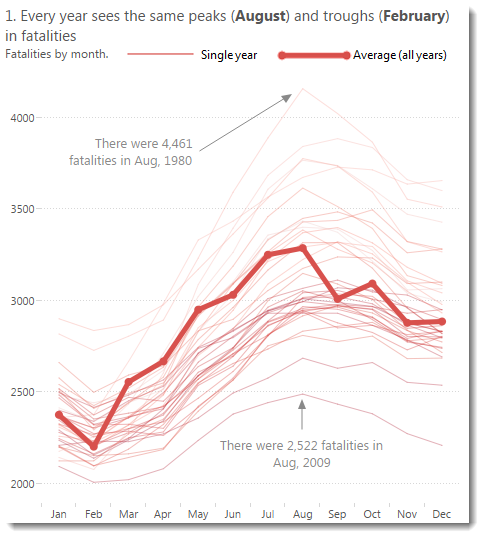
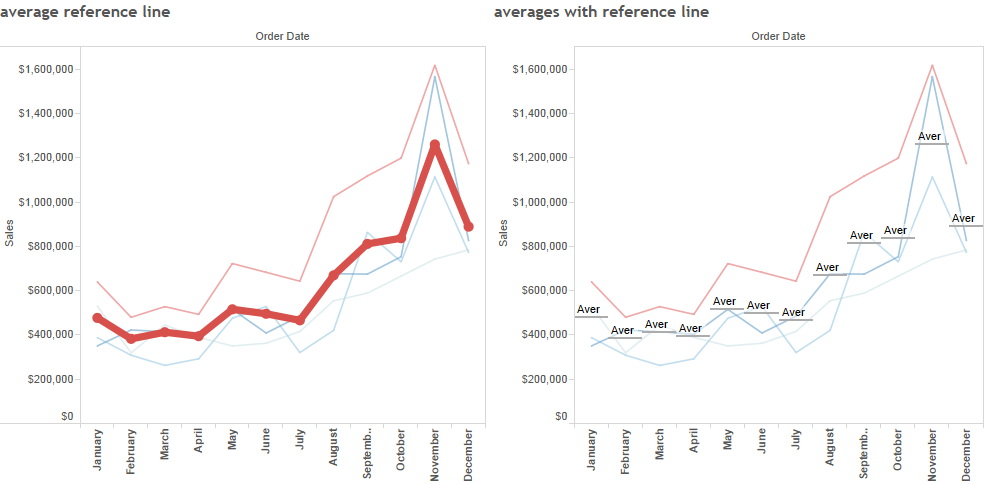
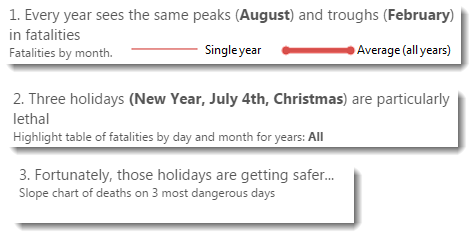
See the thick line in the chart above? That shows the average number of fatalities in a month for all years in the dataset.
It’s the equivalent of drawing an average reference line for each cell in the view, which you can see below:
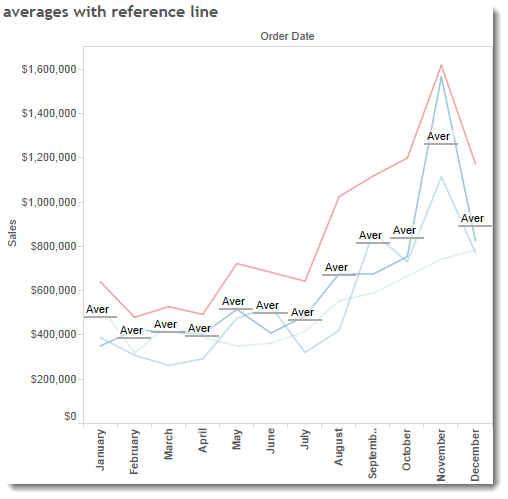
The reference lines are quick and work, but they’re not attractive and are a little difficult to interpret.
To draw the line you need some table calculations.
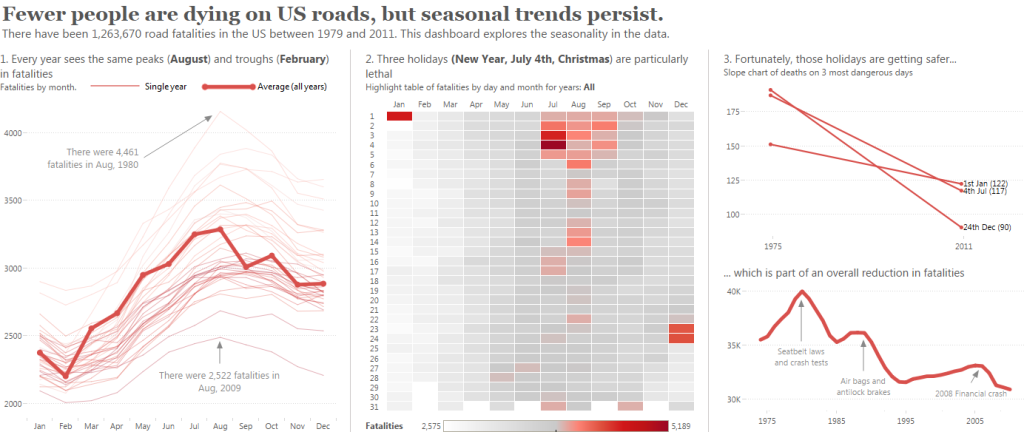
I’ve recreated the chart using the sample Superstore data and you can see the workbook by clicking on the image below:
Making the average line
To make this chart, I start with a basic seasonality view: [Month] on Columns, [Year] on Colour/Detail shelf.
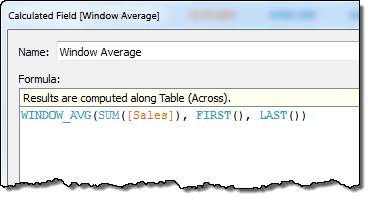
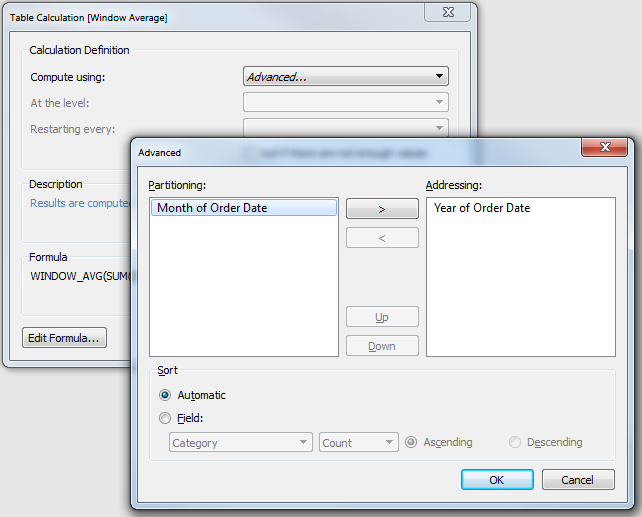
I then need to work out the window average in each month. here’s the calculation:
Drop that onto the Row shelf and set the Compute Using settings as follows:
Now you should have a chart with the regular measure and the average calculation on the Row shelf. Right click one of the measures and choose Dual Axis. Then right-click on one of the axis and synchronise them.
That’s the basic chart done. I had to tweak the Colour, Transparency and Size a little to get a result I was happy with.
An anti-aliasing problem
This is pretty much complete. But there’s one thing that’s niggling. The average line is jagged:

What’s going on here? Well our average line is actually multiple lines, one for each year in the dataset, drawn on top of each other.
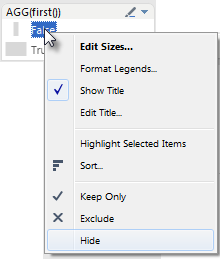
How do we solve that? I created a new calculation:
FIRST()==0
If you set this with the same Compute Using… setings as the calculation above, you get a True/False value. The True value is applied to just one of the lines being drawn on the chart.
Drop this field on the size shelf, right-click on the False mark in the legend, and choose Hide.
This solves the anti-aliasing problem and makes the view that small but significant bit nicer to look at.
Conclusion
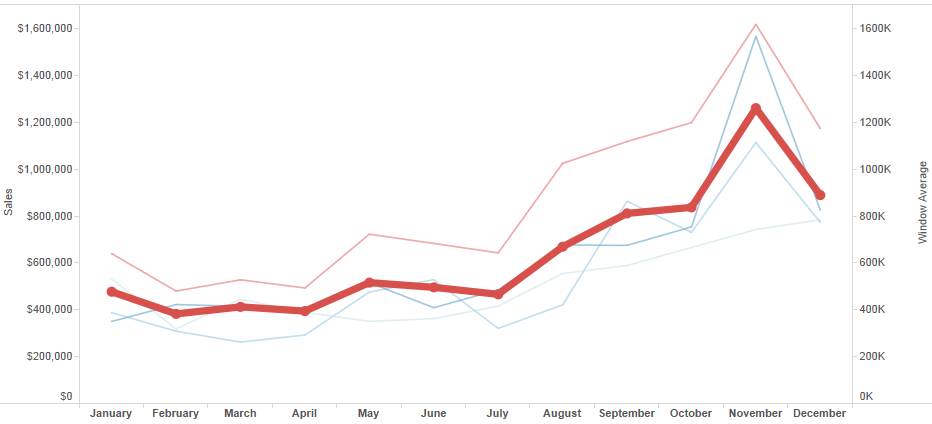
As you can see in the image below, what I’ve achieved is the equivalent of doing a per cell reference line, but made it much more attractive:
What do you think? Is this the best way of showing seasonality? Is there a more efficient way of doing this using simpler calculations?
Click the image below to see and play with the complete workbook:


5 Comments
Add Yours →“I can’t help but hate anti-aliasing” You mean you hate aliasing, right? Anti-aliasing is what fixes the jaggies. Then again, maybe you meant anti-aliasing implementation .. and–if so–then fair enough.
It looks great!
Anthony – you’re dead right. I got myself in a twist. Edited…
[…] Accordingly, sell signals occur when the price falls below the moving average line. […]
[…] Accordingly, sell signals occur when the price falls below the moving average line. […]
[…] term trades). So the price action is above the moving average line and we have a rising moving average line. And this shows a uptrend. ADX being the same if price action was below the MA line and if the […]