
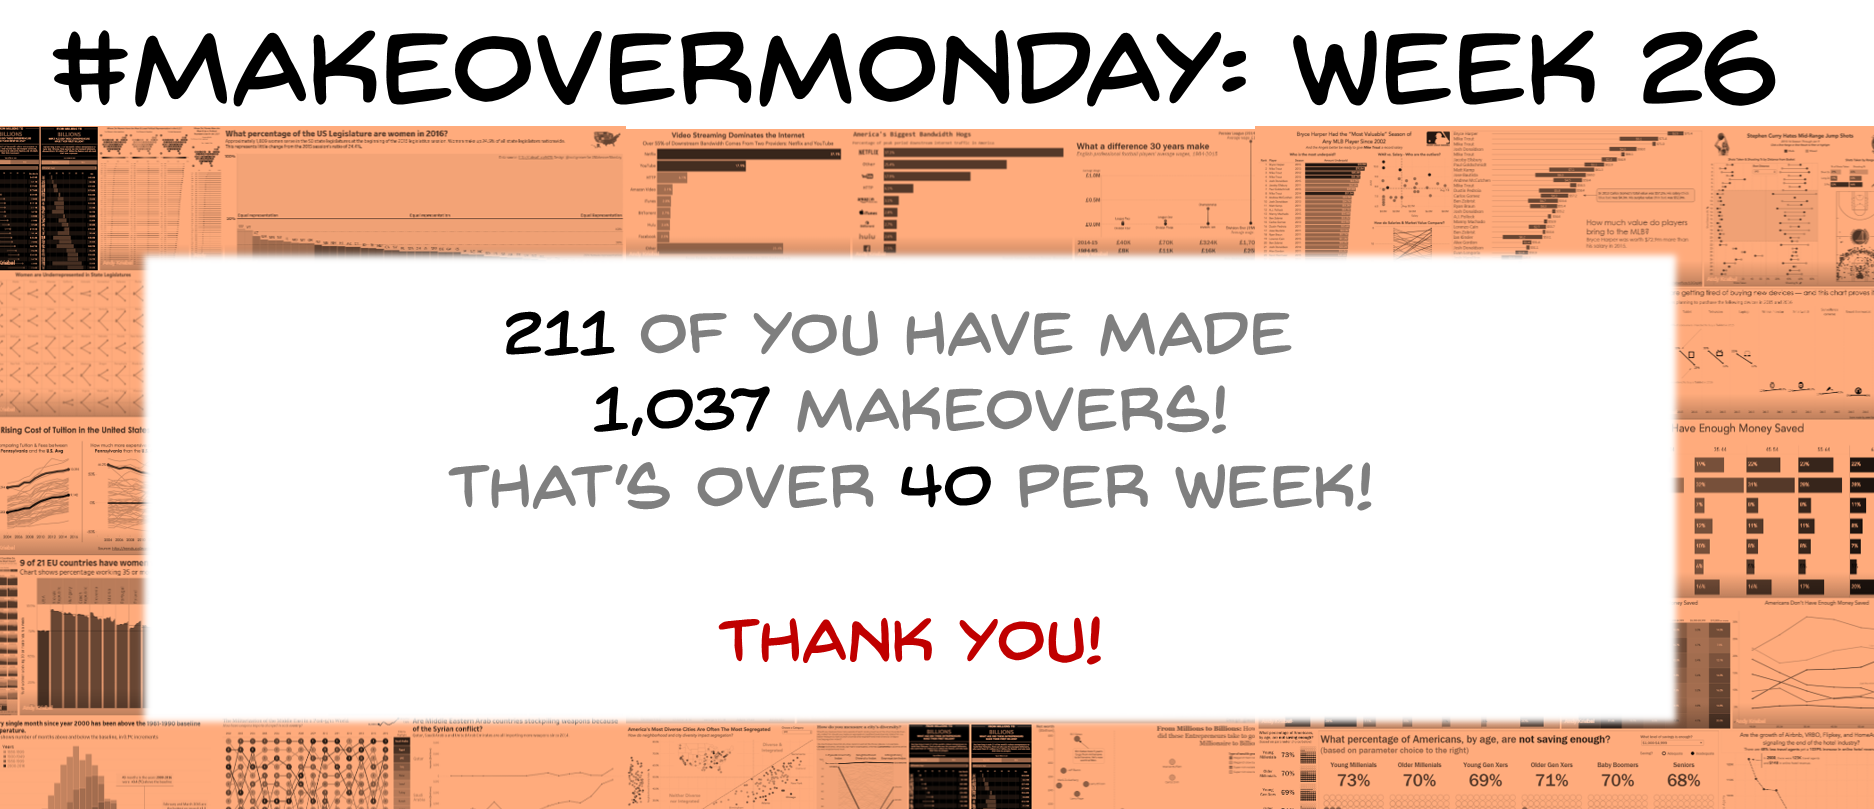
We’re at halfway. Over 200 of you have posted more than 1,000 makeovers over 25 weeks. This is simply amazing.
Where else could you find a growing source of charts and data to play with?
Where else could you find so many different ways of telling data stories?
When Andy and I started this, we thought it’d just be us goofing around. But it’s you, the community, who have made this something more special than we could have imagined.
Thank you!
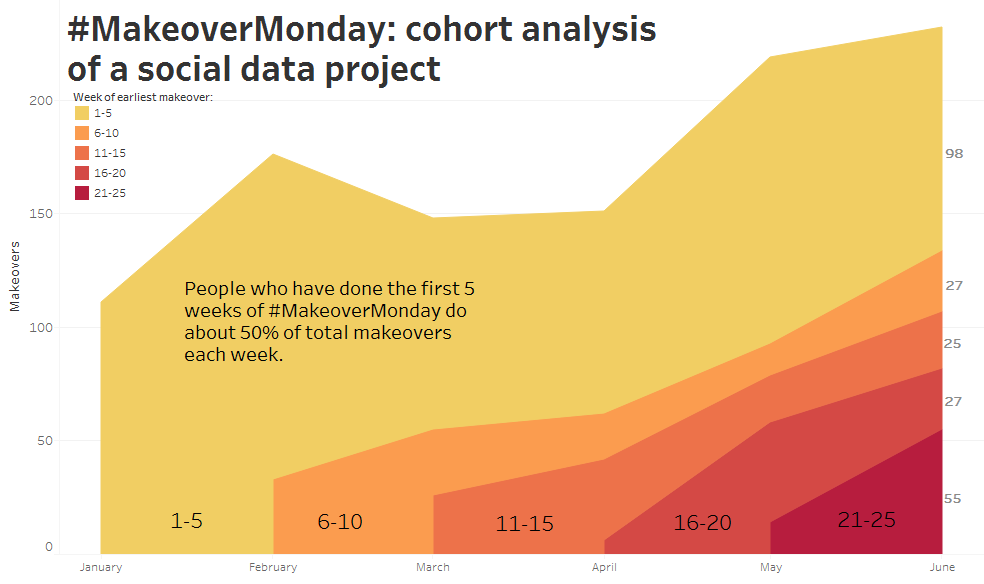
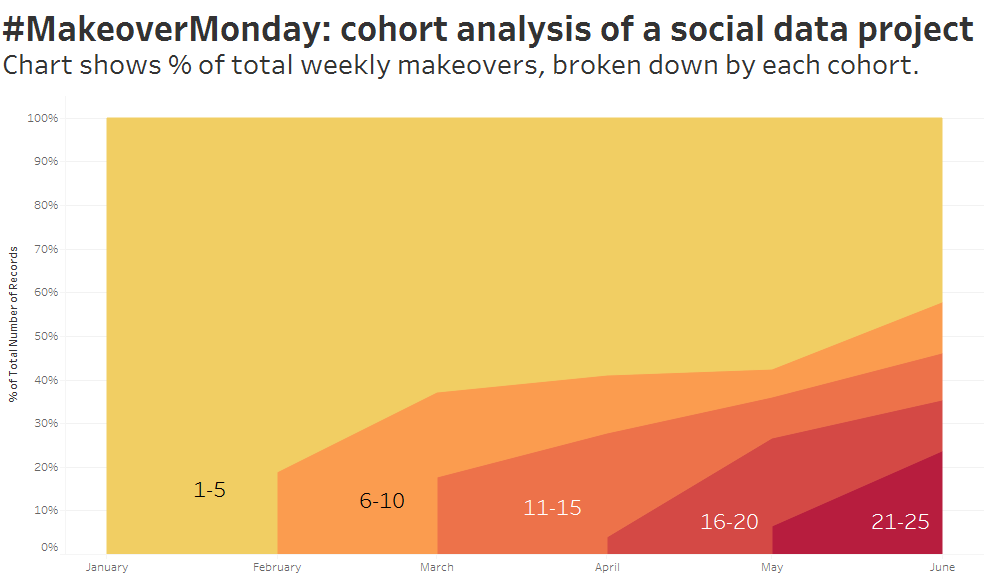
This week we’re making over MakeoverMonday data. I wanted to do some cohort analysis (check out a great post on using LOD calcs for this here). It turns out that those of you who’ve done the first 5 weeks of Makeovers contribute about 50% of all makeovers each week. Below is a percent of total view of the chart above:
Keep it up, gang! I’m loving seeing all the incredible ideas you come up with each week.
1 Comment
Add Yours →[…] https://gravyanecdote.com/blog/makeovermonday/makeovermonday-makeovermonday/ […]