
In my previous post, I shared how I’d found myself at Princeton university, with Steve Wexler and RJ Andrews, to look at Jacque Barbeu DuBourg’s 1753 Carte Chronographique. Seeing that alone was an incredible experience. It turned out they also had copies of Joseph Priestley’s Charts of Biography and History.
These are two other hugely influential charts created in 1765. I talk about them all the time in my talks on visualizing time. Priestley’s pamphlet about the charts are also just like any modern practitioner’s design essay.
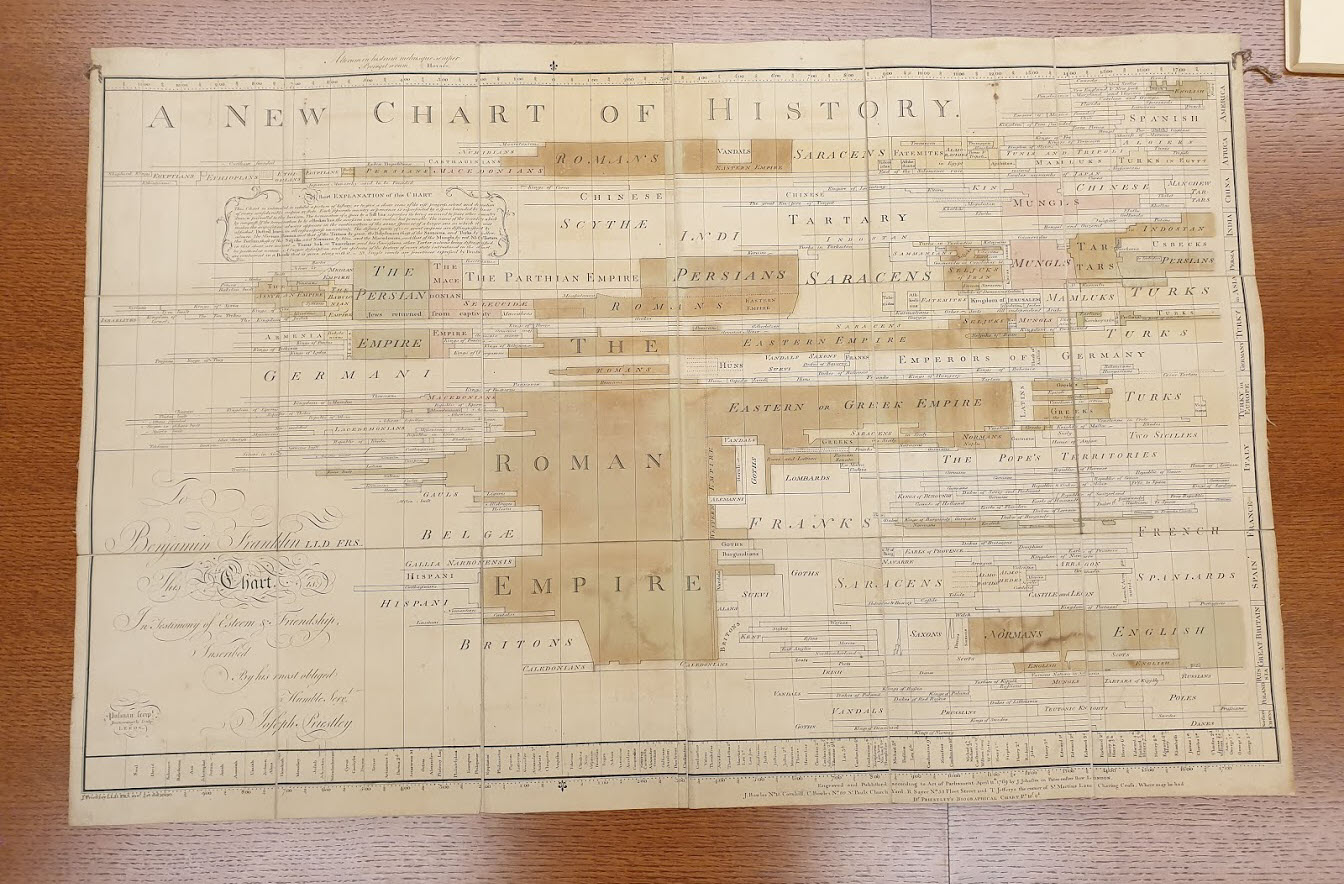
The Chart of History

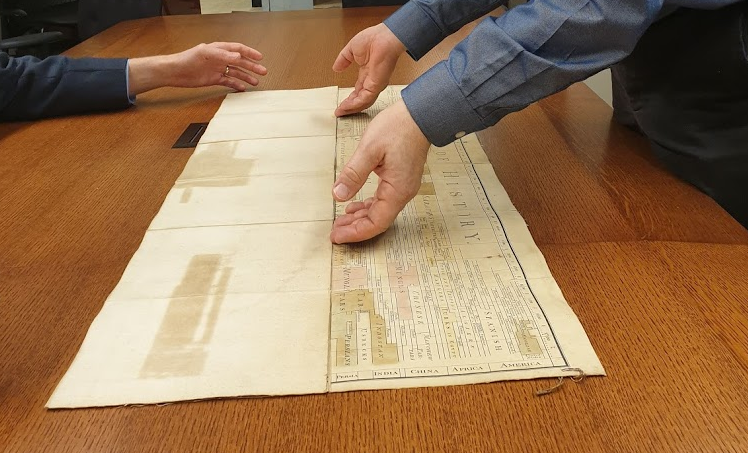
Unfolding this was another careful task:
But there, on the table, was this marvellous, single-sheet view of the entirety history of empires across the globe. All of human history in one sweep of the eye:
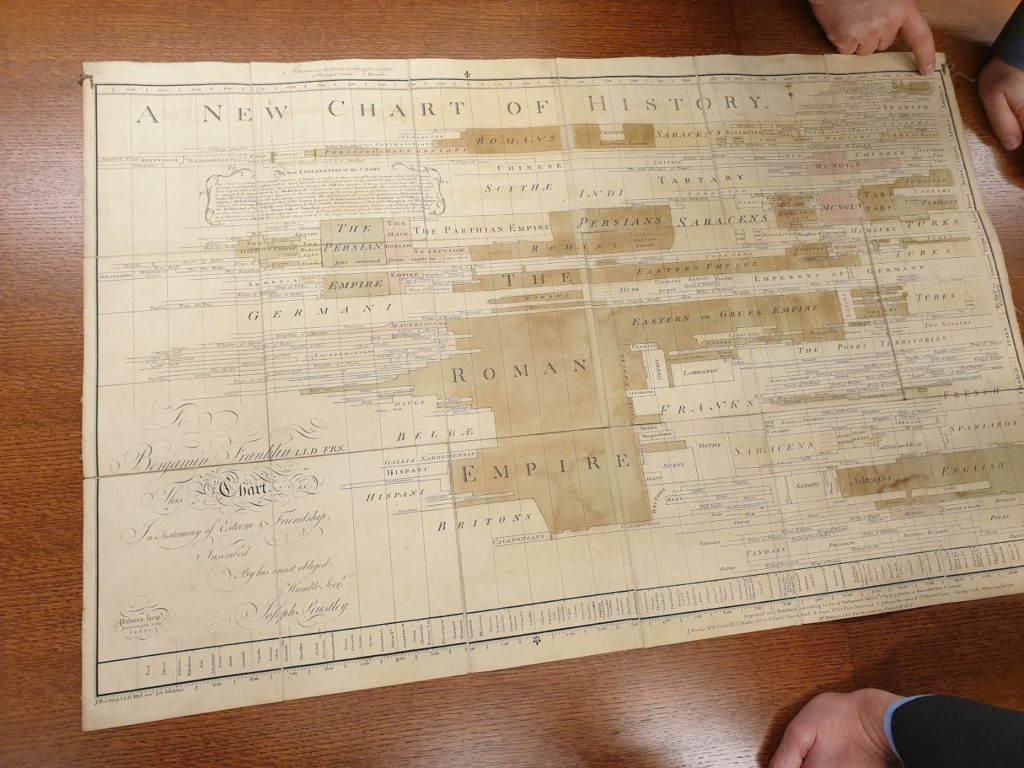
Briefly, the x-axis is history of humanity from approx 1200BCE. The y-axis shows broad geographical regions. The shapes in the chart thus show the duration and reach of empires throughout history. The dominant shape is the Roman Empire. Its size reinforces the geographical extent and longevity.
A detail below shows part of the Persian and Macedonian Empires:

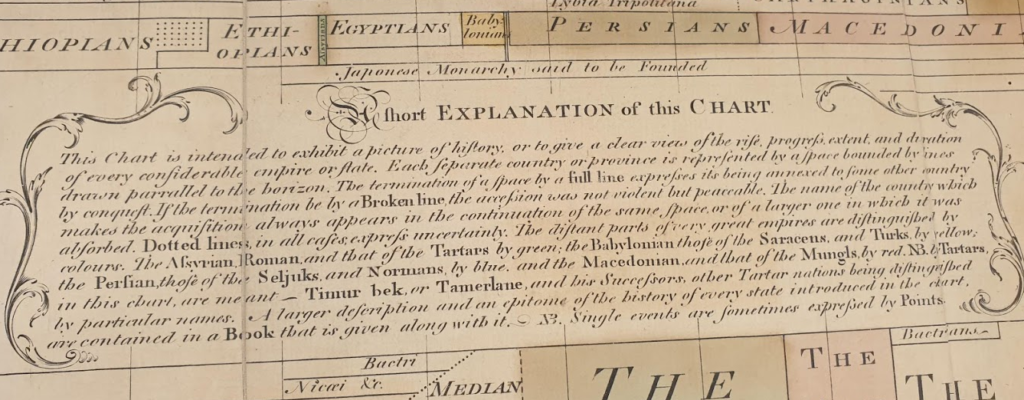
In his accompanying pamphlet, he describes the value of data visualization. Reading the highlighted section below is just like reading any modern take on the power of data (for more details click here)
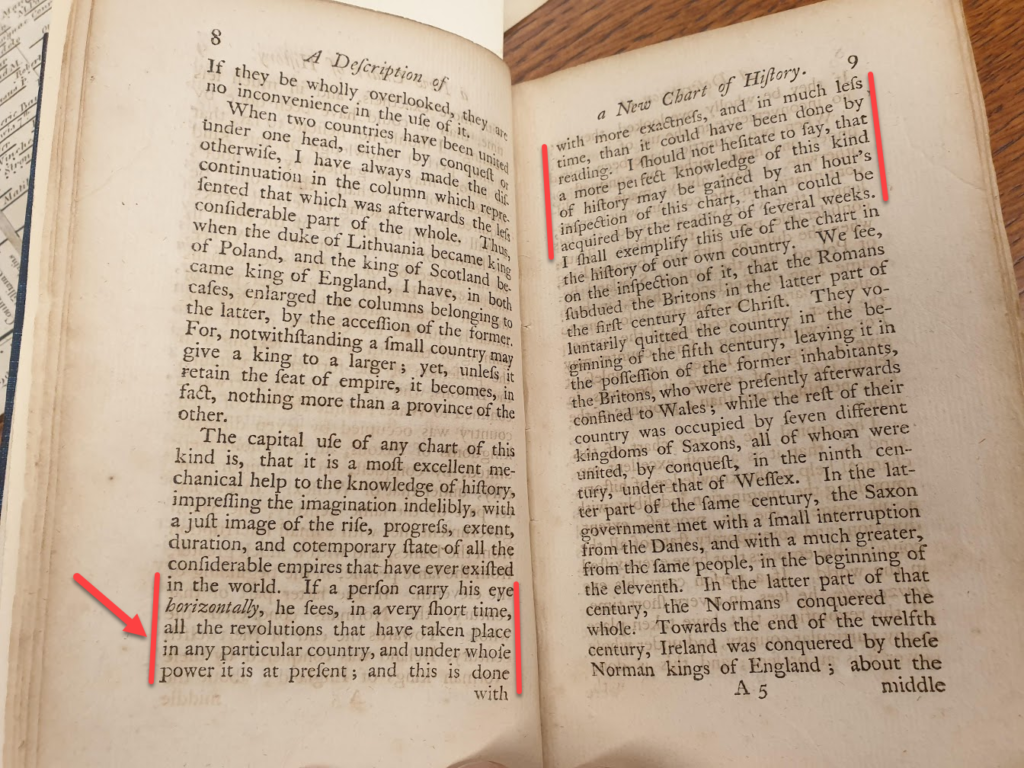
As with Dubourg, experiencing the physical object is utterly unlike seeing photos. There’s so much detail to be seen. I remind you again: these were hand-engraved plates. Next time you throw a chart together using software, imagine doing it by hand, in mirror format, so it could be printed!
Priestley demonstrated many innovations. One of the biggest challenges in data visualization today is how to show uncertainty. He was wrestling with it back in 1765.
His explains how he does it on the chart: “Dotted lines in all cases express uncertainty” can be seen if you read the beautiful caption:
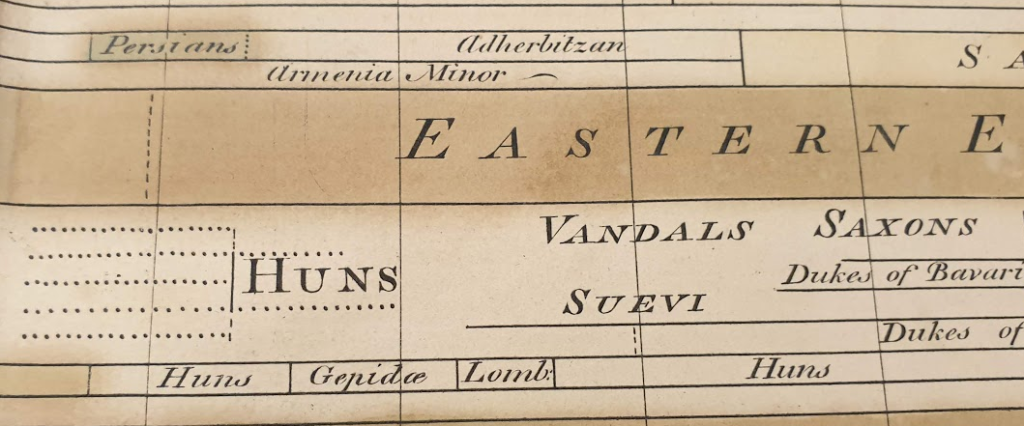
Here’s an example showing the uncertainty of part of the Persian and Huns empires:
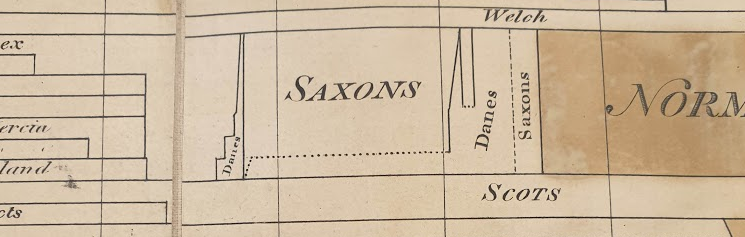
The uncertainty could get complex, but Priestley did his best to show this across two dimensions, as can be seen below in the Danish/Saxon battles for supremacy in Great Britain:
We were able to make a very interesting discovery. The chart was created in 1765. The upper left looks like this:
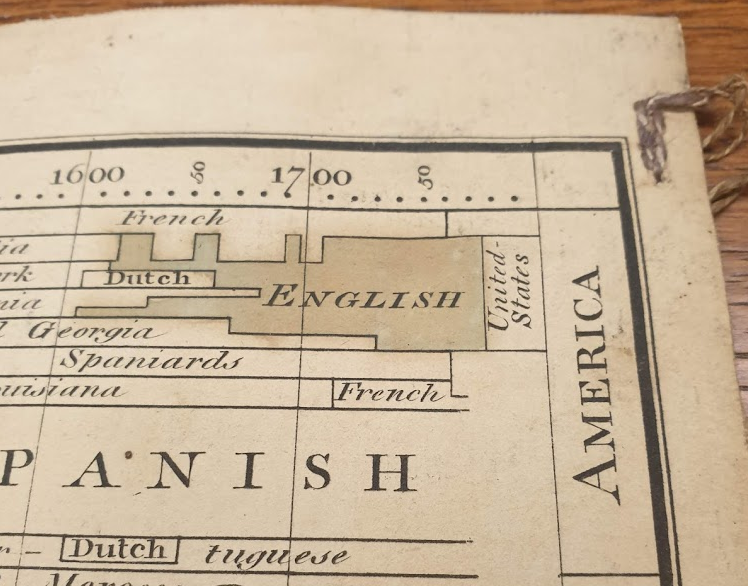
This top row represents America, and you can see the spread of English control as they dominated the French, Dutch, Georgians and Spanish. There on the right hand side, though, is “United States”. Historically accurate, of course, but the US did not exist until 1776, 11 years after Priestley made the chart.
What’s going on? Look at the figure above: Priestley’s horizontal lines do not extend to the right hand end of the x-axis. What we believe Priestley had done was leave space for further engraving on the original plate. Yes: he future-proofed his chart. Today, software extends the x-axis automatically. Priestley certainly wouldn’t have wanted to re-engrave the entire chart, so he built in space for further data to be added later, which was done after 1776.
The Chart of History did not disappoint: we had, in the flesh, a demonstration of caption writing, uncertainty handling, colour usage, and a very clever 2 dimensional display of time and geography.
Little did I know that the curators were about to bring out one more phenomenon: Priestley’s Chart of Biography. Click here to read all about that, or here to read part 1, about DuBourg’s Carte Chronographique.

Recent Comments