It’s the Christmas edition of the Sweet Spot! That wraps up 12 months of, what I hope, have been inspiring and entertaining things to read/watch/listen to, all somehow related to helping people see and understand data. For the final issue of the year, some fun stuff. Still relevant. But fun. See you in 2018!
Secrets to measuring a piece of paper (5 min video, Numberphile)

Numberphile is one of my favourite YouTube channels. This video, by the wonderful Cliff Stoll, provides a brilliant gotcha to teach you a lesson about data collection. It’s a simple lesson but one with big implications: how do people learn to trust their data? Should they trust it blindly? Are they measuring things correctly?
A New Master Blend: Giorgia Lupi and Kaki King (3 min video, Hennessy)
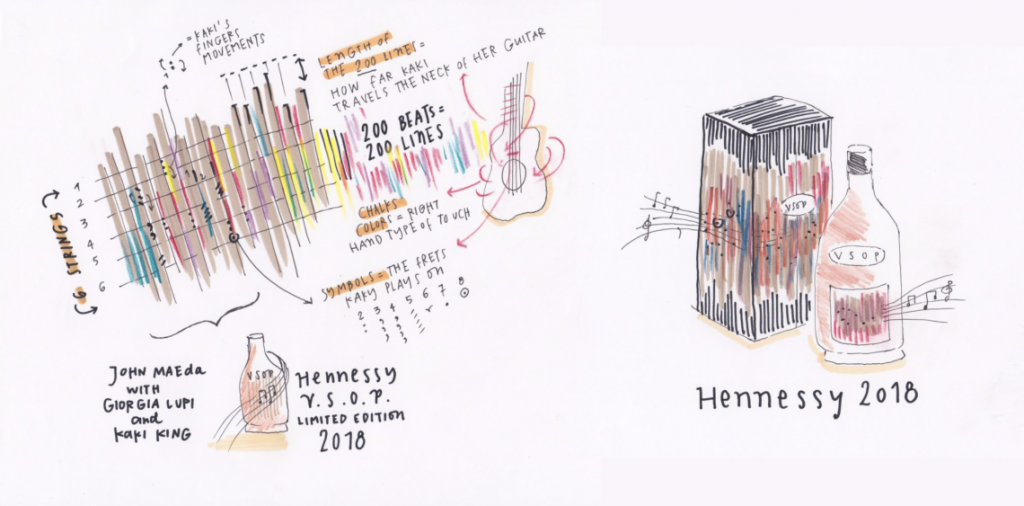
Dataviz, music and cognac: a Christmas gift seemingly designed for the data geek in your life. This is a great project from three inspiring people.
Branded in Memory (15 min read, Signs.com)
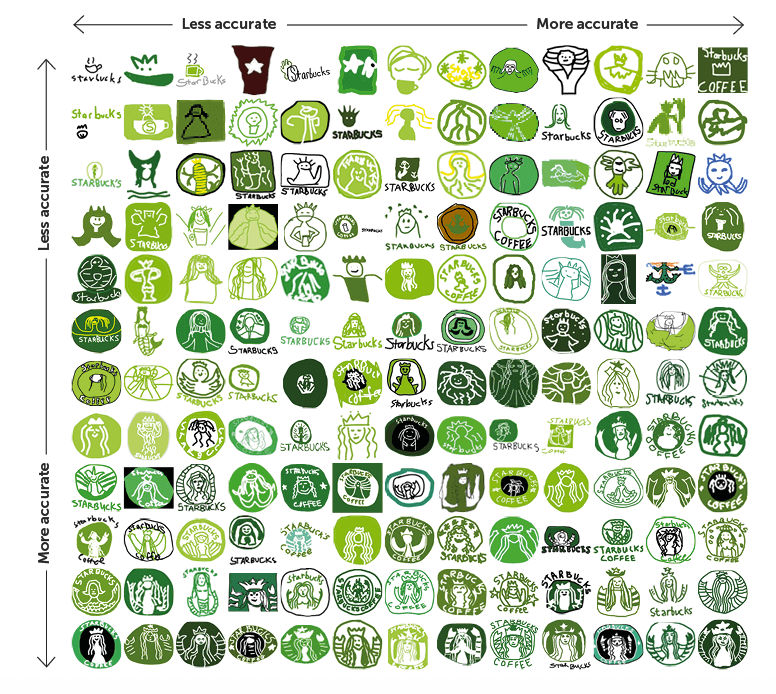
Our visual system is the most powerful of our senses, but our brain’s a little lazy and doesn’t remember everything with complete accuracy. This campaign from Signs.com asked people to draw logos. The results are really interesting, and they did some great data analysis and storytelling with the results. (shared by Louis Archer in Product Marketing)

Recent Comments