
A Spreadsheet Way of Knowledge (20 min read, Backchannel)
“A virtual cult of the spreadsheet has formed, complete with gurus and initiates, detailed lore, arcane rituals – and an unshakable belief that the way the world works can be embodied in rows and columns of numbers and formulas.” That’s my favourite quote from this piece celebrating October 17’s Spreadsheet day (marking the 35th anniversary of Visicalc. When Tableau is 35yrs old, will people look back and reflect in the same way? (That’s 2038, by the way!)
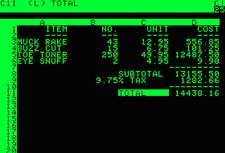
Meet the Spreadsheet That Can Solve NYC Transit (10 min read, Vice Motherboard)
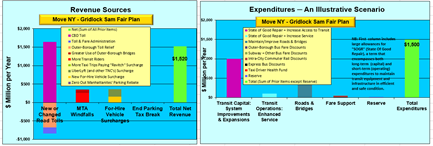
Clearly there’s life in the old spreadsheet! This article strikes an almost romantic tone as it describes the depth and complexity of a spreadsheet that models NYC’s transport system. Read it and marvel at how far we’ve come with Tableau. I’m amazed at how this is so anachronistic and yet, somehow, appropriate? Go download the spreadsheet itself and marvel at the charts, and the maintenance nightmare this must be. Surley we could model this with a good database and Tableau?
Mission One Complete! (5 min read/watch)

Shall we map the entire world, every day? Why yes, why not? We’ll need a bunch of our own satellites to create 1.4 million images daily (that’s 6 petabytes of data, each day!). That’s what Planet did. Now they’ve built it, think of the possibilities of this dataset. Their promo video is crazy: imagine measuring a country’s economy by measuring the number of ships in a port each day? Or tracking natural disasters more accurately than ever before? Sure beats the Excel datasets described above! Their promo video really sets the scene.


Recent Comments