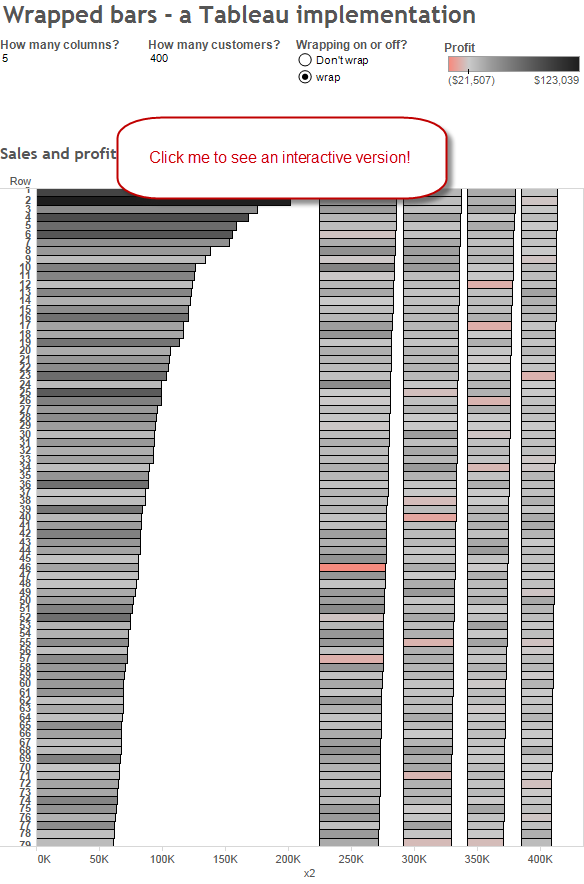
Click here to see the interactive version of the wrapped bar chart.
Click here to see the interactive version of the wrapped bar chart.
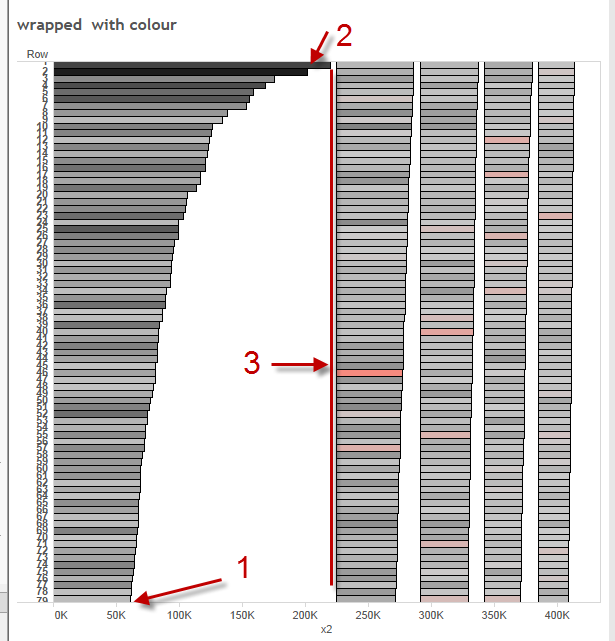
When I saw the wrapped bars paper, I thought it would be good to see if Tableau could cope with these. Below is my best attempt. I must say at the outset that the implementation is complex and probably too complex to be considered a practical implementation of wrapped bars. My motivation was just to see how far I could push Tableau.
I have also posted my thought on the Wrapped Bars in a separate post.
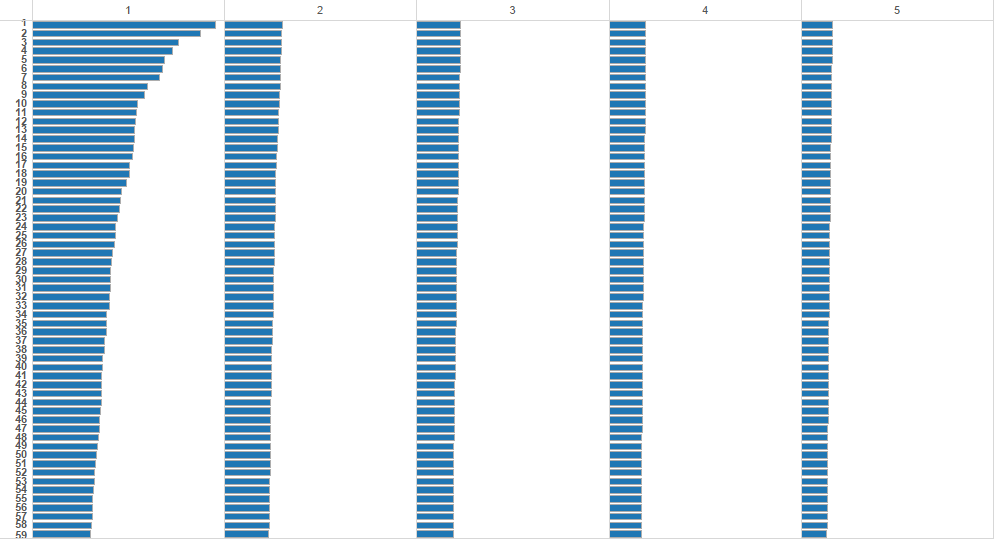
I initially figured I could reuse the principles I used to make Panel Charts a couple of years back. This requires use of the INDEX() calculation along with some modulus arithmetic. It didn’t take long to implement that, but there’s a big problem:
What’s the problem? Tableau’s columns are all the same size. You can’t dynamically set the size of each column differently.
That had me stumped and, pretty much defeated. So I went for a walk: that’s where I do my best thinking. A solution came to me: Gantt charts. Using Gantt charts I could position each bar anywhere along an x axis. But at a price: huge calculated field complexity! In principle I needed to calculate three things (see the figure below)
1. The number of rows in each column
This is pretty straightforward: 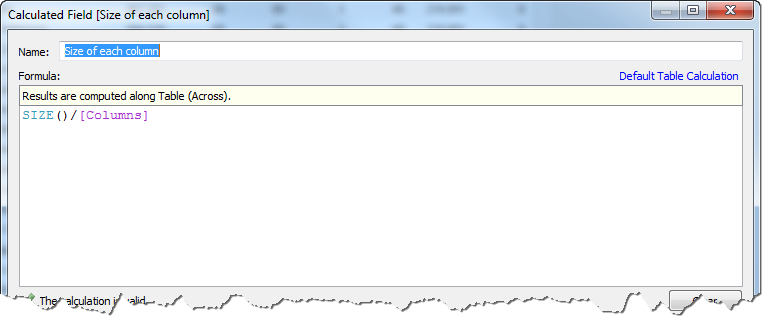
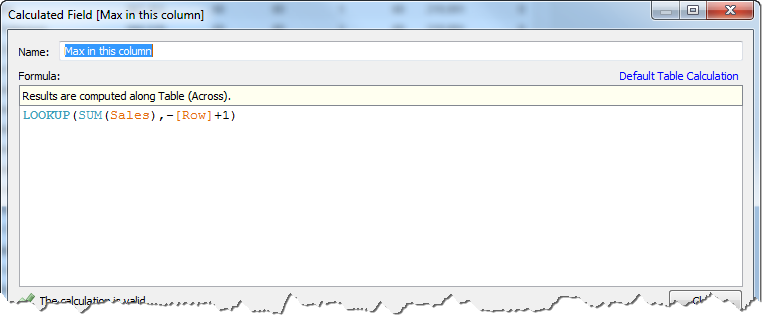
2. The length of the first (the biggest) bar in each column
3. The position on the x-axis to start each column
This one was a stinker!
Once the calcs were built, making the chart itself was a breeze.
Is this practical?
I’ll let you decide that – let me know what you think in the comments or on twitter (@acotgreave)


1 Comment
Add Yours →Hi Andy, this is impressive! Have you figured out a way to do this with a table? I realize Tableau is not about lists… but when your manager wants one… lol. It’s a reasonably short list of inactive employees where splitting it into 3 – 4 columns would suffice. When I google, I find instructions on text wrapping – but that isn’t what I am after. I have an employee number, name, and the word “Inactive” in a table and that is it. I could make 3 tables and split by alphabet – but then they show as an uneven number of rows. Do you know of a way to do this? Thank you!