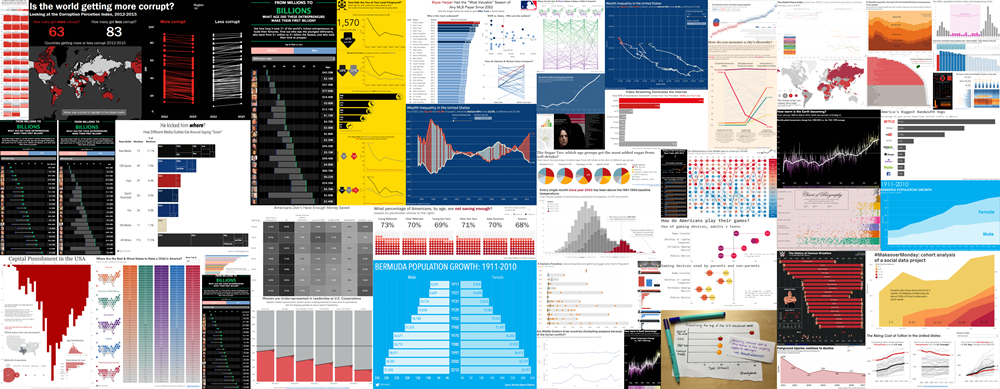
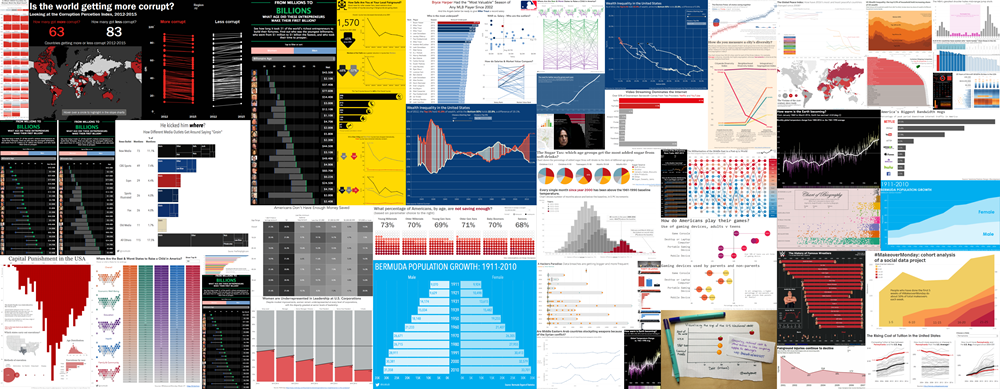
The 2016 MakeoverMonday project is coming to an end.*
How was it for you?
I want to know what your favourite week was, and why. What have you learnt? What have been your highlights (and lowlights)? What’s the effect been on your community? And the wider dataviz community?
I’ll be writing a post on tableau.com before Christmas so please share you reflections with me, in the comments, on Twitter, on your blogs, or anywhere else I’ll see them!
* What does “coming to an end” mean? Andy will continue to add datasets each week. However, as of the end of the year, we will cease to update the Pinterest board and the dashboard of statistics. We hope you all still continue!

16 Comments
Add Yours →It’s no secret that Makeover Monday has been a big part of my year and my development as a Tableau user. I’ve gone from almost nothing to, well, someone who vizzes a lot,and has certainly got at least a bit better. The effect on my community has been massive, that’s quite obvious. I’ve blogged on it here:
https://questionsindataviz.wordpress.com/2016/09/02/what-is-makeover-monday/
My favourite was the Malaria in Africa week. It gave me the idea for a simple Africa tile map which I’d never seen before, and what started as a quick hobby Sunday/Monday experiment got commissioned by a magazine in France. I don’t even think my submission was all that good, but it was proof that if you capture someone’s imagination or strike a chord with them that that *almost* doesn’t matter. I’d never have thought something like that would happen prior to #MakeoverMonday!
Downsides – there have been a few squabbles and opinions I didn’t always agree with. But if everything was black and white, or there was only one correct and right way to do things, that at the very least a “Questions in dataviz” website would be somewhat redundant! It’s the healthy debate and differences in approach that keep it fascinating.
The priority for me is to learn something and try something new each week. Today, having done every week from 7 to 49, I decided to try week 1, and was still able to try a chart type (dumbbell) that I’ve never tried before. It’s a great learning opportunity – ultimately it’s 52 fascinating datasets with the opportunity to try something alongside a growing community. You gain from your own attempts, gain from feedback, and gain from looking at others’ ideas and contributions. Win-win-win!
Makeover Monday has played a big part in my development as a Tableau user & has helped me to engage with others in the Tableau community. Prior to participating in Makeover Monday I had only ever used Tableau to build professional dashboards at work. However, Makeover Monday has given me the opportunity to experiment with different chart types & explore data sets & subject areas I would not otherwise have discovered.
Makeover Monday has also helped me form friendships with other partipants all over the world, many of whom I was lucky enough to meet at Data16.
My favourite week was the Alan Rickman dataset. Prior to that week I had no idea who Alan Rickman was! Nevertheless, that week became my favourite Makeover Monday dashboard. It goes to show you don’t need to be an expert in the subject area to participate in the project.
I love how popular Makeover Monday has become & I really hope the momentum continues into the New Year.
Hi Andy! I’ve been participating for the last couple of months and have found it a lot of fun and a valuable opportunity to learn! I first used Tableau over 8 years ago and have dabbled a bit since, so for me a lot of it was about revising what I had once known and also discovering the range of functionality and design possibilities from the pros and zen masters. It has also enabled me to discover the blogs and videos of others which is a great way to learn more. It was very beneficial to get feedback from others in the community. This can either validate something you did or give some tips for improvement. I also found the project really motivating. It can often be difficult to make yourself sit down and pick new things to learn at random. This offered a weekly deadline with an opportunity to try new things each week. With everyone looking at the same dataset you get to see different approaches and it allows you to be part of a conversation about data happening in real time. Thanks so much to the two Andys for all your effort as I’m sure there was plenty of it!!!
Thanks Louise! Did you have a favourite week?
Hi Andy,
I really enjoy Makeover Monday. It has been the main factor in helping me come out of my shell and muster the courage to publish my work. Not all my vizzes are great, of course, but every week I learn something new.
I think the focus and encouragement to keep it simple, make it a 60min exercise and to just have a go have been really helpful. I try not to overdo it. I have never had a talent for artistic endeavors, so I stay away from graphic design adventures with photos and elaborate detail. I stick to simple charts but try to make them speak for themselves by giving them space and making them clear and concise.
Makeover Monday has definitely helped me gain technical skills as well. This goes hand in hand with becoming part of a tight-knit community. Every Monday I see great visualisations by a number of people who get involved. I can download their workbooks and learn how they did it, but I often also just let their work inspire my next viz. I now have access to many more people and their blogs than before and what they post beyond Mondays is also extremely valuable. I seek out their information, their videos and tips and tricks to improve my own work.
Makeover Monday has become a regular part of my week. I often catch myself saying to colleagues or friends ‘I know this person through Makeover Monday…’ (that does require an additional explanation, to be fair).
I find it fascinating to see how 1 dataset, no matter how simple or complex, can be visualised in so many ways.
There have been great discussions, some very straight-forward, some more passionate and heated, about visualisation topics. And with every tweet, post and uploaded workbook, I have learned, improved and hopefully also contributed something to the wider Tableau community
Cheers
Eva
Hi Andy,
Going into 2016, I had resolved to get more involved in the Tableau community and #MakeoverMonday gave me that opportunity. Being handed interesting data sets and a (admittedly soft) deadline for visualizing it every week was exactly what I needed to regularly engage with my virtual peers – I could discipline myself to devote at least an hour a week towards that activity. And that was my initial impetus – an excuse to just put myself out there in a way I hadn’t before.
But as the year went on, #MakeoverMonday became a much larger and more important part of my life. Not only have I developed some great online friendships as a result of it (friends I do hope to meet in-person in 2017!), but it has allowed me to flex my creativity in ways I hadn’t associated with data viz before. Vizzing in public (vs. just for internal corporate reporting) encouraged me to pay more attention to things like color, font, layout, etc., which in turn has made data visualization so much more fun and satisfying than it had been prior. I actually wrote a fairly lengthy blog post about why this new creative outlet has been so wonderful for me.
https://mixpixviz.blogspot.com/2016/08/a-love-letter-of-sorts-to-makeover.html
Picking a favorite week is tough, but if I had to choose one it’d be Arming the Middle East (week 21) because that was the first week when I spent a lot of time considering the entire “story” of my viz and brought in design elements like background images to augment the data. From that week forward, I found myself far more likely to experiment and take risks with my vizzes.
The only real downside to this whole experience might be that I can sometimes obsess too much about a viz. I’ve never been a stickler for the hour guideline, but there have been some weeks where I’ve probably spent 4-5 hours collectively on a viz – from initial exploration to multiple iterations that I’d come back to throughout the course of a day or two – which is time that I took away from other activities like time w/ family. But I have found that this tendency has lessened throughout the year simply as a result of practice – practice with different viz types, design elements and with finding a story in the data. So the negative is turning into a positive. 🙂
Thank you and Andy K for starting this. As we’ve all noted numerous times already, it has become much larger and more important than probably any of us thought possible back in the early weeks of 2016. I’m very happy to have been a part of it from the beginning and definitely intend to continue participating in 2017.
Makeover Monday has been a consistent waypoint in my nine months of learning how to use Tableau. My approach has been scattergun; I’ve randomly digested blogs, videos, forum posts and many other thing, but Makeover Monday has been the reliable constant aiding my development.
It has given me confidence to share my fumblings with the community, and to constructively appraise other submissions. I look back on my submissions and can see my development, technically and aesthetically over the months.
As the manager of a team of analysts, it has given me a fresh dataset each week to take my team out of their collective comfort zone and encourage them to try new things.
It has been a terrific experience for me and many others. I can’t thank you and Andy K enough for initiating it, and I’ll wholeheartedly be continuing it in 2017 and beyond.
Here’s my year of Makeover Monday in a nutshell.
Nov 2015: Left #Data15 motivated to up my Tableau game in a big way for 2016. I spent a week feeling incredibly inspired by the community, but a complete outsider. I’m the only “Tableau person” in my org and I knew 0 people in the community.
Dec 2015-Jan 2016: Stocked up my twitter follows and blog roll w/ community all-stars. Consumed content like crazy.
Mar 2016: After many weeks on the sidelines, completed my first Makeover Monday (Wk 11 Corruption Perceptions Index). At this point I have ~50 Twitter followers. I think it is the coolest thing ever that Andy K likes my tweet. Later found out this means nothing,he’s just marking it for Pinterest ;). I am overjoyed that Andy C. tweets an encouraging note to me. I think this is the pinnacle of achievement.
Apr 2016: My 3rd week participating was week 14 Urban Diversity (I skipped week 12). I discover the data set late on a Saturday night and jump right on it. By the time I wake up Sunday morning I have over 50 new twitter followers and over 100 notifications. I have no idea what has happened? Have I greatly offended someone? On Monday it is named Viz of the Day. The following Monday, it is named Viz of the Week (where it stayed for 2 weeks because Ben forgot to appoint a new one. Thanks Ben!). That viz has over 14k views now. Something that astounds me daily.
From this point on, I’ve felt like a valued member of the community and have been able to connect and collaborate with so many incredible people. I have spoken twice at our local TUG in the past 6 months, was invited to speak at Tableau Fringe Festival, am the Community leader for the Retail VTUG, and had the opportunity to speak at #Data16 on behalf of my company. I now have 360 twitter followers which I consider no small miracle. I feel empowered to contribute ideas to the community, and have found the relationships to be unmatched. I consider many of the folks in the Makeover Monday community close friends now. That was never a goal.
In short, Makeover Monday has been transformative for me in many ways. I’ve met incredible people, dramatically improved my skillset, and have had the opportunity to build a public profile in an incredible way. As Josh Tapley has stated multiple times, people watch Makeover Monday. I’ve had job offers originate from this one-hour task that I simply considered ‘professional development’.
Cannot thank you and the community enough for the enriching experience this has been.
Thank you everyone for your thoughts! I’m so glad you’ve enjoyed the experience.
I only started using Tableau a year ago and even then only on training courses. I started MakeOverMonday on Week 28 (Orlando Shootings Media). At this point I could just about build a simple clustered bar chart. Since then I have really tried to push myself to learn something new most weeks. So my favourite weeks are those where what I have tried to learn has come off eventually. So for example, whether it be my first interactive dashboard was Week 34 (Malaria) or my first dynamic title was Week 36 (Alan Rickman). I have learnt how to apply my classroom notes in the real World. I have also learnt so much more through having access to all the great content people blog and post. For example I learnt all I could about Slope Charts for Week 40 (Peace Index) from blogs of Andy Cotgrave and Andy Kriebel – thanks Andy(s)!
However this approach has meant that it takes me longer than I would ideally like each week. Creating my first Hex Map dashboard for example based upon a blog of Matt Chambers (@sirvizalot) was a great achievement but I spent way too long on that particular week. This is something I aim to work on next year.
I recently gave up my long term career as a research and intelligence manager in the public sector to become self – employed! I have just started a freelance business intelligence company called ‘Datawoj Ltd’. I had a plan that I could visualise data using Tableau but lacked the skills, experience and contacts. MakeOverMonday has given me an excellent starting point to grow from in all these areas. Some of the Makeovers involve the sort of data and techniques such as Satisfaction Survey data (Week 41) for example, that I will be visualising in my new role. I now have a portfolio to send to prospective clients. I have made lots of great contacts through social media, from Zen Masters to rookies alike. So I really feel MakeOverMonday has changed my career for the better.
The impact upon my community will be if I can introduce some of what I have learnt to my clients who are less familiar with data visualisation, but will make better decisions as a result of the work I provide. The wider impact is to create a unique online resource and to have unskilled and connected 495 contributors Worldwide.
Thanks very much to Andy and Andy for such an enjoyable and inspiring project. I am looking forward to continuing to learn and grow next year.
Thanks Colin for sharing the story. Good luck next year!
I followed the Tableau community for a year or so but never engaged or attempted to create my own non-work related visualizations. After following Makeover Monday for a while, on week 21 I finally decided to set up a twitter account and attempt a makeover. After a few Makeover Monday’s, I gained confidence in my ability and began creating dashboards using data sets I found on my own. Makeover Monday also allowed me to play with new ideas and concepts that might not be practical in my day job while also allowing me to continuously learn new things. I also thoroughly enjoyed looking at other people’s takes on the same dataset, since they often found or thought of things I never would have! Through joining the Tableau Community, I connected with Ryan Sleeper, since we both live in the Kansas City area. Starting in the beginning of 2017 I will be joining Ryan’s team! I give Makeover Monday all the credit since it allowed me to build a portfolio and connect with the community.
I loved the variety in datasets, but my favorite was probably week 22. I liked this data set because there was a lot of different angles and the subject was appealing to me personally.
Thanks for setting Makeover Monday up- it’s been amazing!
Wow! What a great story – thanks for sharing it Lindsey. Good luck in 2017.
I have twice had a song played on the radio (Radio 1), and when it has happened, I’ve been giddy at the thought that millions of people across the country are experiencing the same thing as I am at that very moment, all because of something I’ve done.
I get a similar feeling about Makeover Monday. The audience is slightly smaller, and the things aren’t being done at the hands of me, but there’s a wonderful feeling about a bunch of people all doing pretty much the same thing.
Except they’re not. We’re all presented with exactly the same thing: an article and a couple of links to datasets. And that’s it. Some will reach for the xls, others for the tde. Some will reach for version 9.X, others to 10.Y. And then we go and play.
And we create a wealth of hugely varied dashboards. Sometimes we’re each working with no more than a dozen data points. Yet each dashboard is different. Some are subtly different to others; others are wildly different; and some just blow you away.
I am hugely lucky to be a part of this. The community is the strongest and dearest I’ve ever come across. They like and retweet, they give feedback and are always positive. I love that.
I also love the fact that it’s optional. My time commitments are such that I can’t get to every week’s Makeover Monday. The most recent one I undertook sat on the steps outside my daughter’s carol concert on Wednesday evening. My bum was cold, but that didn’t matter.
As to my favourite datasets? I rather enjoyed the footballers’ salaries one.
https://public.tableau.com/views/Footballwages/Dashboard1?:embed=y&:display_count=yes
Women in the workplace was also a highlight, done as it was live at the Tableau conference, just after I’d walked out of my successful Certified Professional exam. (Brutal!)
https://public.tableau.com/views/MakeoverMondayWomenintheWorkplace/WomenintheWorkplace?:embed=y&:display_count=yes
But I loved the reaction I received to my Shipping dashboard.
https://public.tableau.com/views/Shipping_7/Shipping?:embed=y&:display_count=yes
Thank you to both Andys for helping nurture a fabulous Tableau community, and for adding some extra spice to my Sundays.
Thanks Dan – that’s a great story, and I’m delighted you had such a good experience this year.
[…] this blog post, Andy Cotgreave asked: “What has MakeoverMonday meant for […]