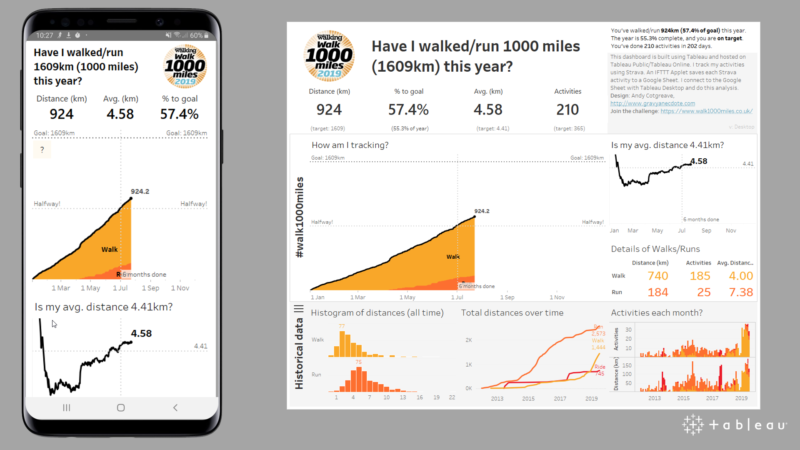
I did it! I completed the “Walk 1000 mile challenge.” This year, I walked and ran for over 1000 miles (1609km for those of us who do metric). I recorded every time I walked for the sake of walking: this included long hikes in the Alps, extended walks to and from school, or heading between meetings on foot instead of public transport. I’ve averaged over 4.5km a day (2.7miles) and the end result? I feel great. As I write I’m at 1675km with 25 days left of the year!
Also: I tracked it all using Tableau, Strava, IFTTT and Google Sheets. And you can do it too: it’s easy! Here’s how. The trick is to get your data into a Google Sheet. Earlier this year I showed how to use a Strava Web Data Connector to build Strava art. You could use that connector to achieve the same thing, but this is much much easier.
I then use an IFTTT Applet to connect Strava to a Google Sheet. Whenever an activity is completed, IFTTT sends summary info to a Google Sheet. The data I use for my workbook requires the following fields:
- CreatedAt: when the activity started
- Name: the name I gave the activity in Strava
- ActivityType: Run/Walk etc.
- DistanceMeters: how far I went
- ElapsedTimeInSeconds: how long I took
- LinkToActivity: the URL of the activity

Now you’re tracking your data! That step will all happen automatically. Next you need to connect Tableau to your Google Sheet.

That’s you all set. At this point, you can build your own analysis. Or you could download my workbook and replace the data source with your own.
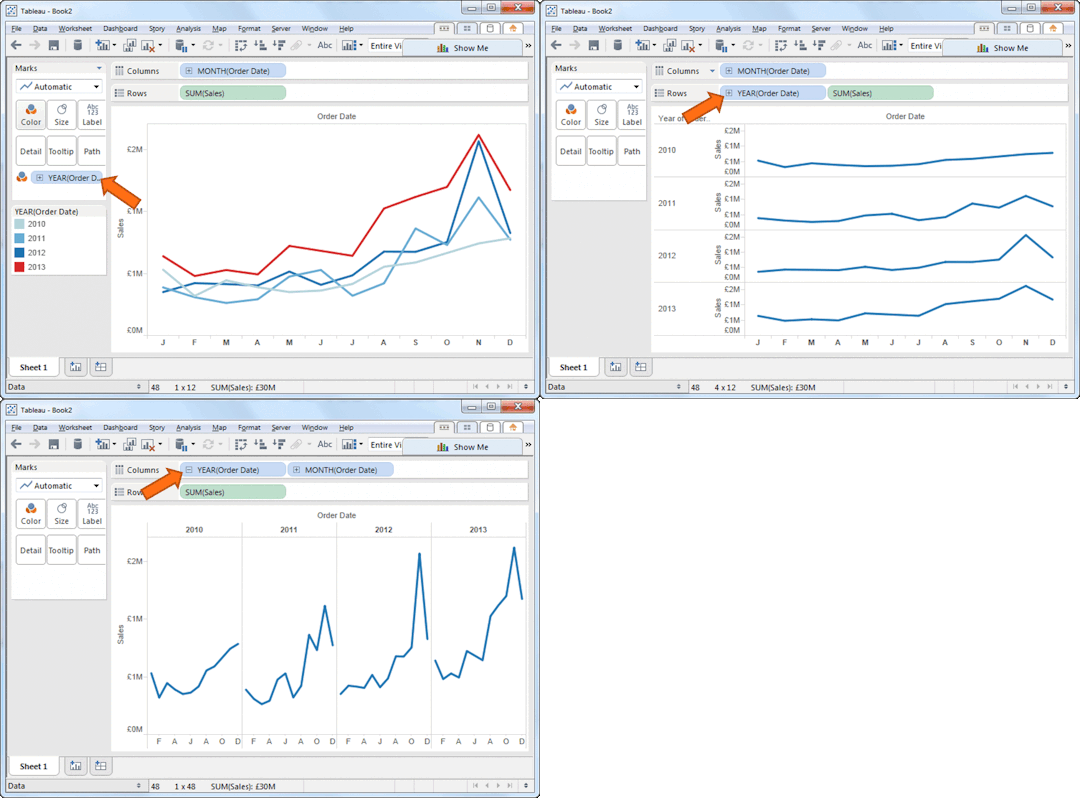
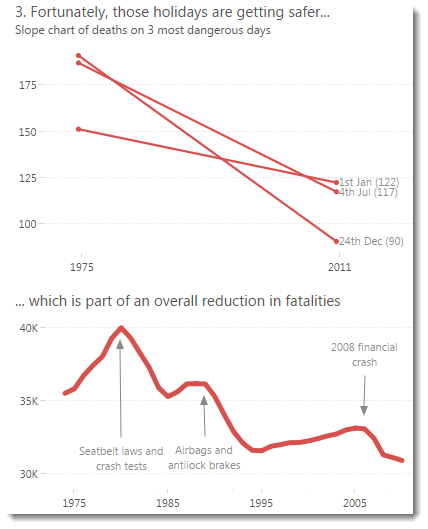
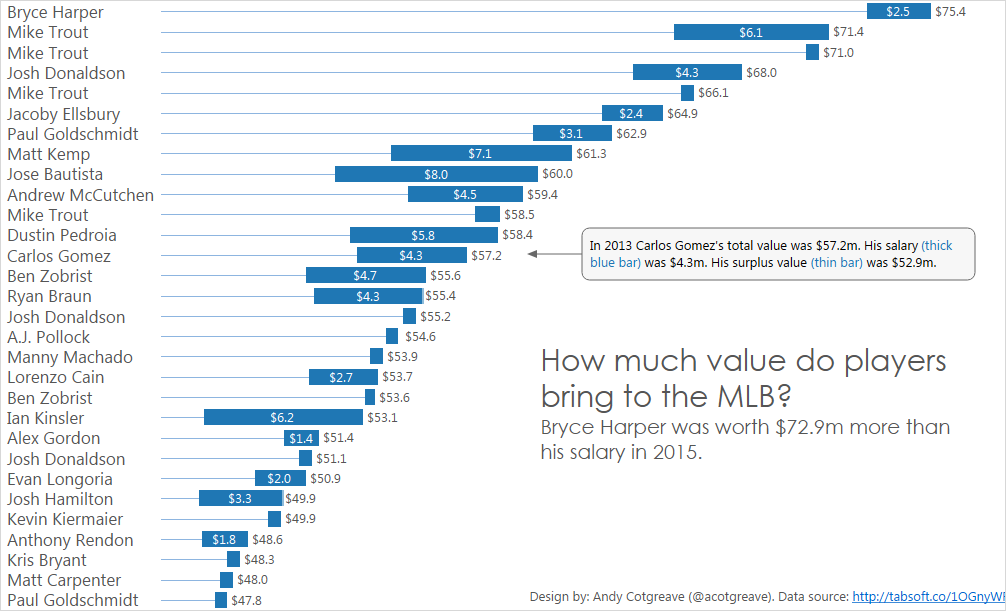
The workbook has lots of views, designed especially for mobile viewing. I used this dashboard to write some earlier posts this year on designing for mobile.
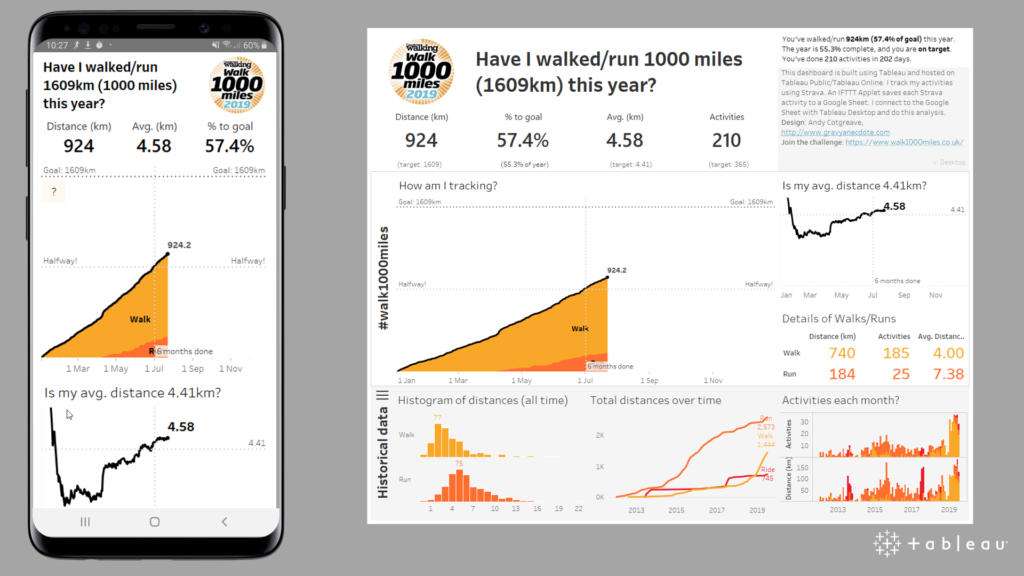
I hope you’ve enjoyed this. Should you track your own data? The most important thing to do is be healthy. I highly recommend you try the “Walk 1000 mile challenge” – it’s been very rewarding. I personally find the data aspect fascinating, especially looking at the last 7 days activity, and the average daily distance as they changed over the year.
Some people track their walking using pen and paper. That’s fine! Others, of course, don’t track it at all, and just walk for the sake of it. Whatever you do: get walking!

2 Comments
Add Yours →Andy, This premise is brilliant. I was hoping you could help me along on this. I have downloaded your workbook but trying to incorporate my data. I only cycle but have a 6 month goal. To reach x amount of miles by 6/30/20
Hi Andy, as a data analyst I wanted to do something of my running data and actually I really love your strava data viz with Tableau ! Maybe you can help me take inspiration of it 🙂 I managed to connect to the web connector but then the “My GPS streams” table appears empty in Tableau (whereas I can see the data in “My activities”) would you know what could be the issue ? thank you ! Magali