You’ve spent hours crafting the perfect dashboard. It has some time based data on it and you’ve used Tableau’s amazing date hierarchy to build it. Every pixel is perfect. You publish it, proud and delighted.

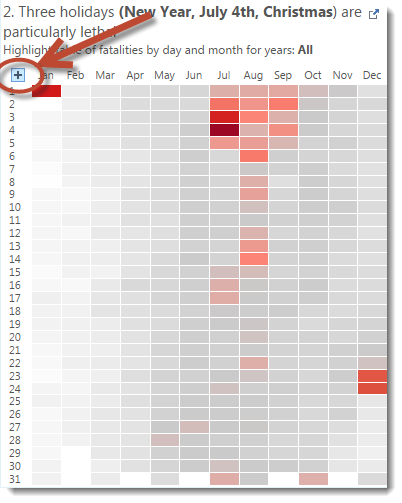
And then someone interacts. They see a plus button. They click it.
Boom! What happened? The view’s broken.
The viewer leaves your view confused and somewhat disappointed.
Have no fear, this needn’t happen to you.
The plus button is designed so you can drill into and out of hierarchies (find out more here). It’s an amazing feature for exploration and works well on many dashboards.
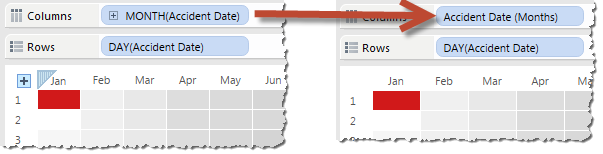
Sometimes you don’t want this behaviour. In my highlight table above, for example, I don’t want my users to be able to drill into the date any further.
To get rid of the plus buttons when using dates, you can use custom dates. These are date fields focussed on just one level of a date hierarchy and cannot be expanded.
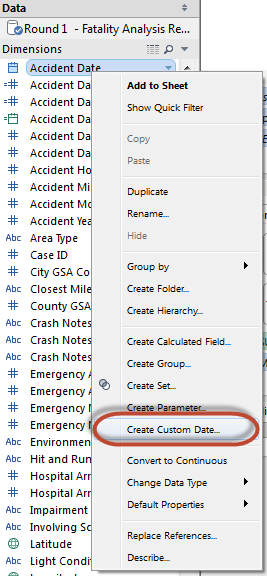
Right-click on your date field and choose Create Custom Date:
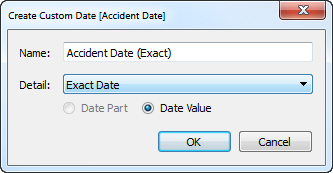
Then choose the date level you want. You can create discrete (“Date Part”) or continuous (“Date Value”) fields at any level from day to year.
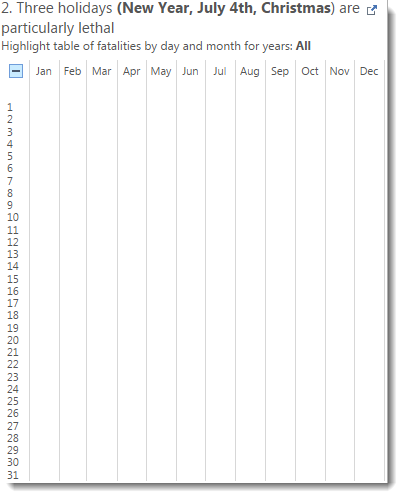
You now have a new dimension available. Put the new date dimension onto your view instead of the original date and your view no longer has the plus symbol.
Well done. You’ve just got control of your guided analytic dashboard back!

1 Comment
Add Yours →This is a good tip. Thanks.