I’m delighted to have begun a new series with Tableau, If Data Could Talk. In this series, I’m digging out stories about data and data storytelling from across all spheres of life. My goal is to bring them to life with lively discussion, and explain how those stories can help you in your own use of data, wherever you used it.
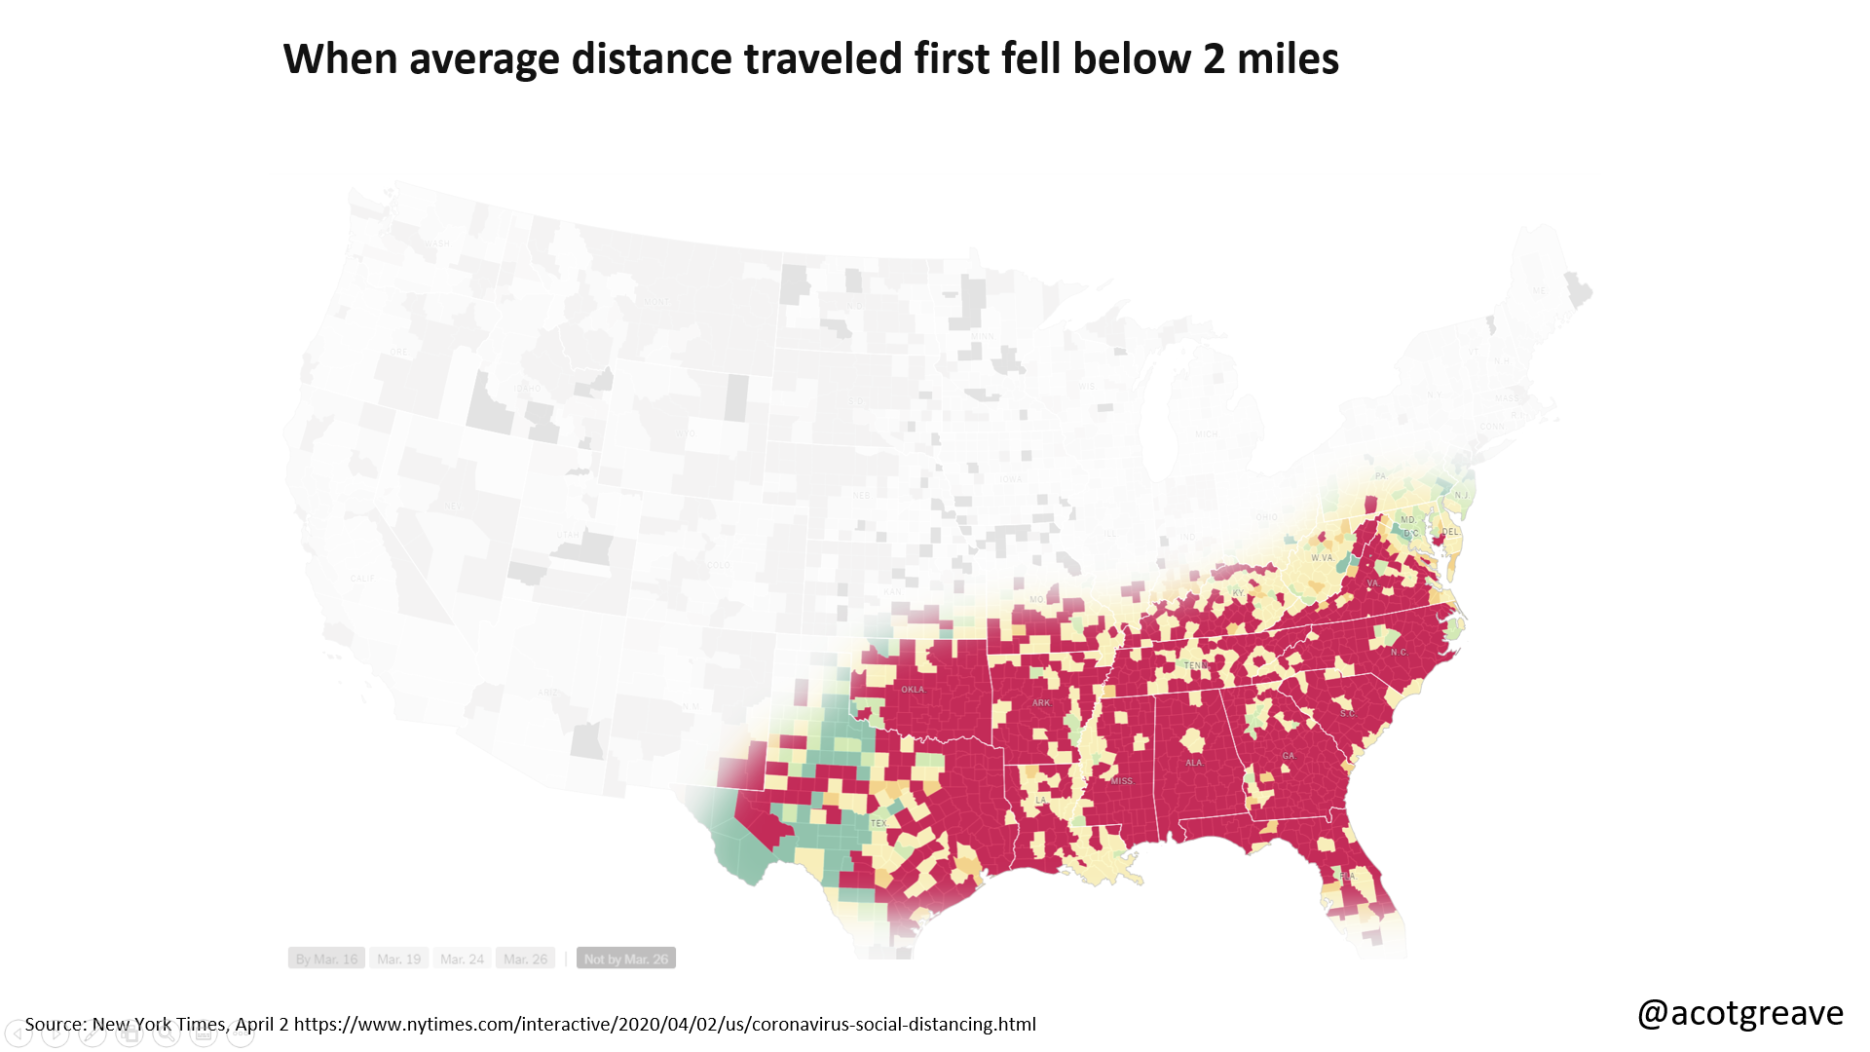
In Episode 1, Amanda Makulec and I discussed some of the most interesting COVID19 visualizations we’d seen in early April
In Episode 2, Sarah Wachter from Tableau joined us, and we discussed the perils of using forecasting features to look at COVID19 data:
Episode 3 saw Amanda and I looking at consumer patterns, visualized by Yelp and the Washington Post. We also chatted with Chatilly Jaggernauth about being a “data explorer”
I am thrilled to be able to host this series, and look forward to developing it over the coming year. We’ll continue to find the stories that are bringing data to life from all spheres of life.
Do let me know what you think!

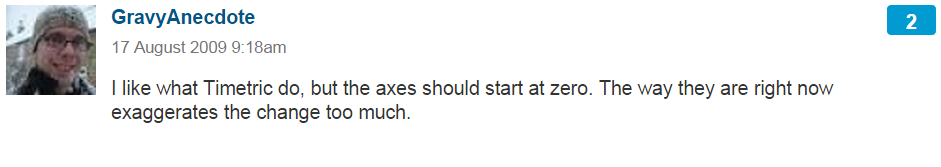
Recent Comments