
Hello again. We didn’t manage to answer all the questions that were submitted in yesterday’s #AskAndy webinar. But don’t worry, we collected them all, and I’ve written some brief answers to each one.
Apurvaa Vijay Sharada: Do you think at some point the beauty of dataviz overtakes the actual intent behind it? If yes, how do we avoid that pitfall?
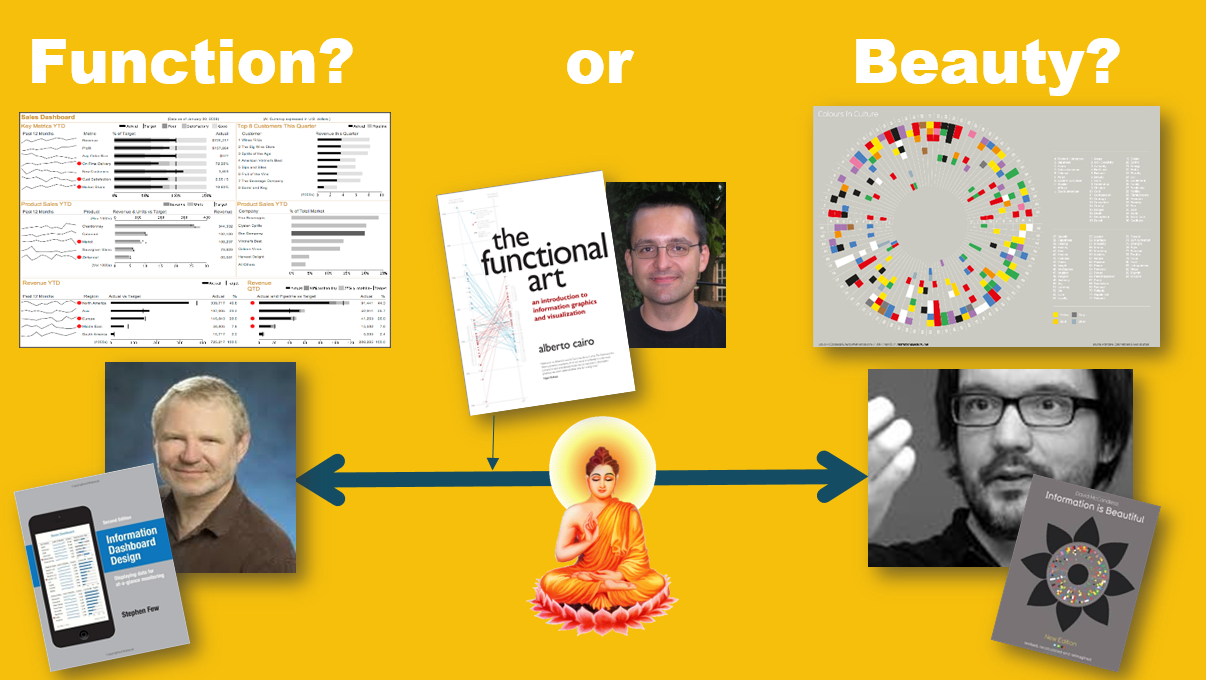
Yes – this can happen. You need to remember the purpose of your visualization. Always take a step back and ask if it’s actually possible to discern the meaning from the visualisation. Ask other people if they understand your viz. Adding beauty will make it more engaging, but unless you’re actually making data art, keep checking that the view actually works.
Melissa Black: What do you think are the most common mistakes made with visualisations?
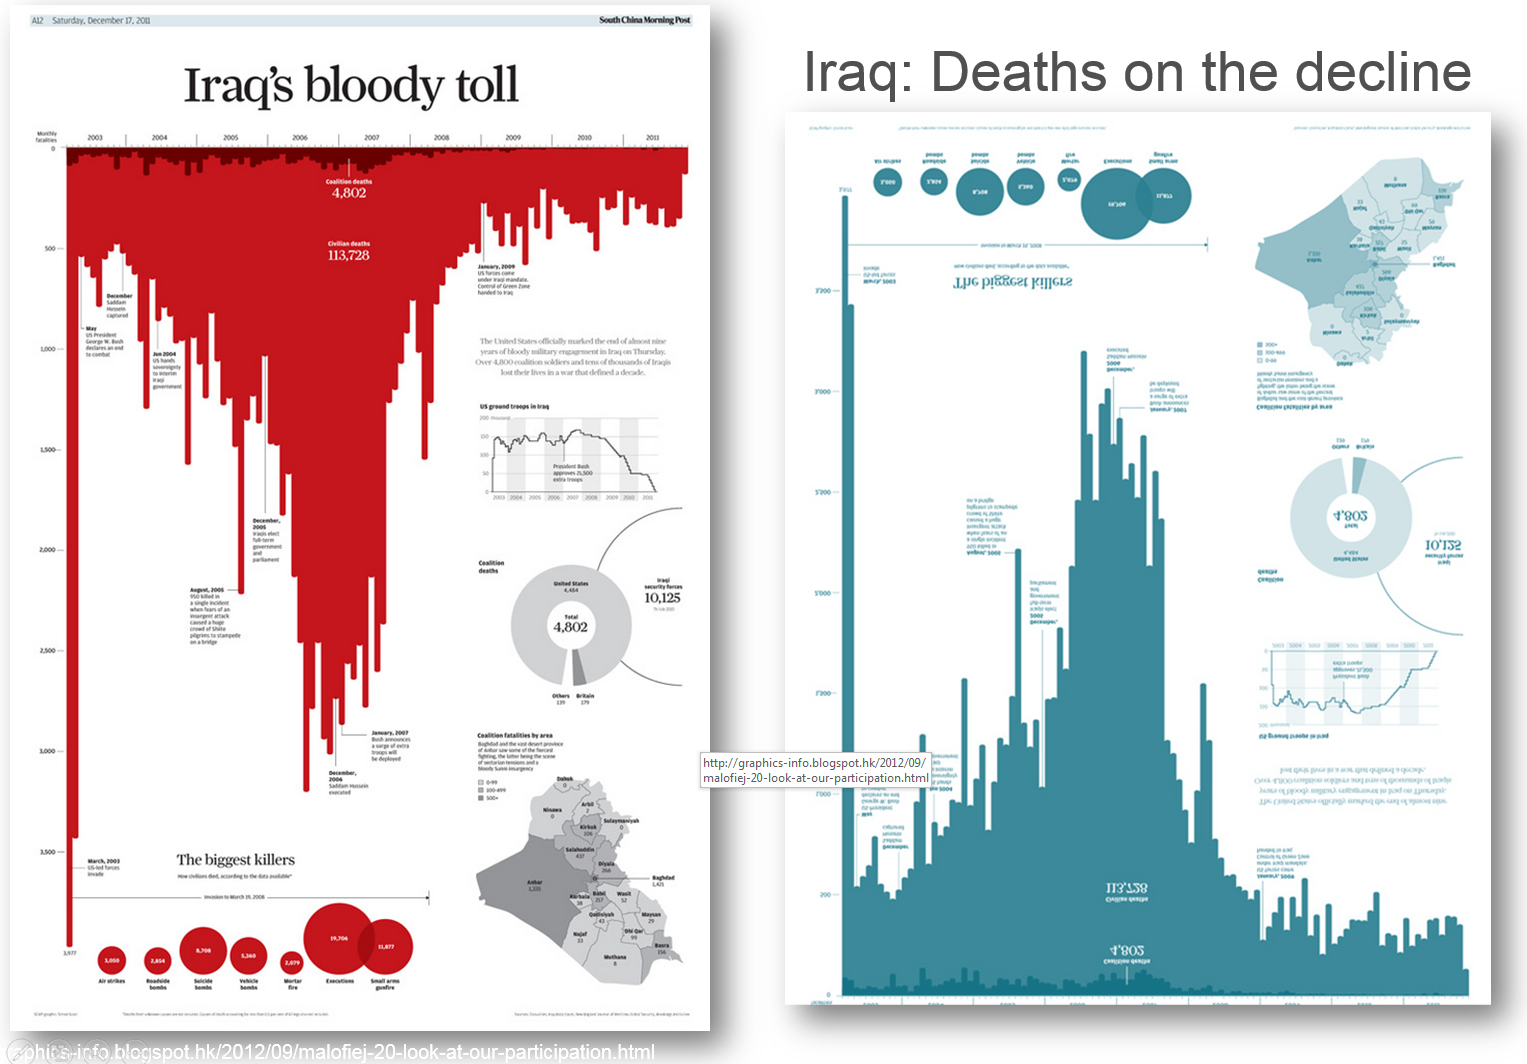
Thinking of beauty before functionality! Many people get enticed by whizzy effects BEFORE they’ve learnt the basics about effective visual communication. On a practical note, I see many visualizations with disappointing titles. The title and caption are a chance to set out the exact purpose of the visualization. It takes moments to think about something appropriate and it can make a big difference to how it is interpreted.
Paul Banoub/Nicholas Bignell: Have you noticed any variations in dataviz trends / styles / usage across different global regions?
Great question. You know what, I don’t think I have. However, I do remember seeing a post somewhere on the blogosphere about this recently, but cannot find it. If anyone has that link, it was a useful read.
Imogen Robinson: Hi all, my question is: how can data visualisations be made more effective in informing decision-making?
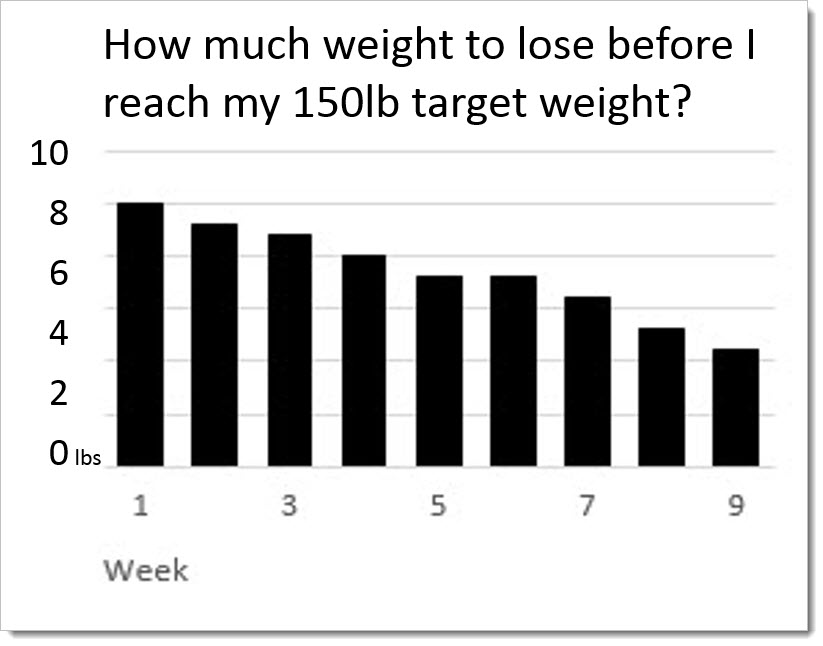
 The titles tell the story
- Make the titles of your views questions. Eg “Should we invest in Singapore?” The question reflects the decision you’re trying to reach. It also forces you to look at your view and ask yourself – does the view help me decide. If not, you have the wrong view.
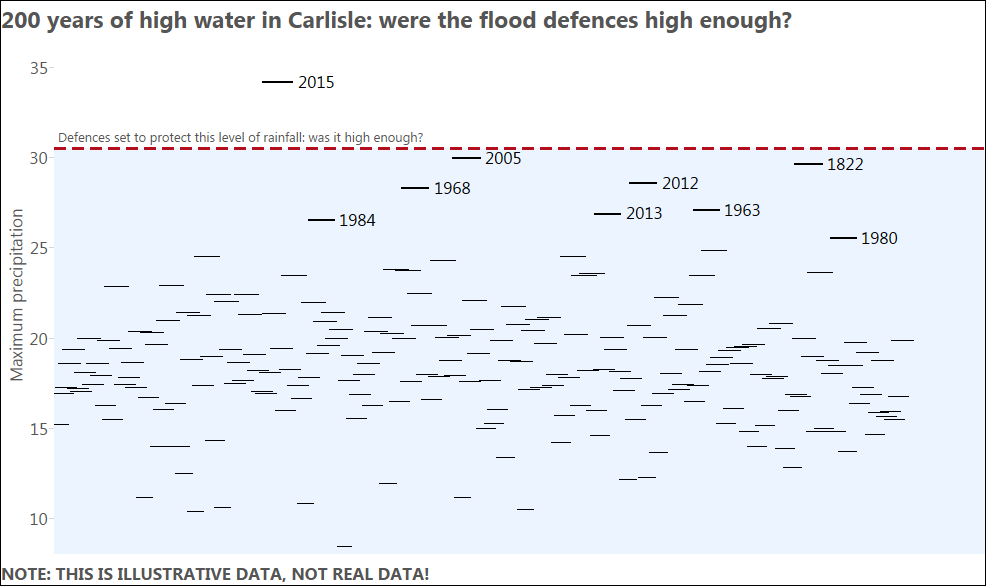
- Use reference lines to show where thresholds are being beaten – anything above a line, for example, needs attention. You can also use simple colour schemes for this. eg grey for most things, and red for those that need action.
- Use scatterplots as a way of comparing measures. This helps you determine if one thing causes another.
Peter Wallis: Could you point us towards some other good blogs to help newbies?
I use and recommend Feedly for blog reading. You can import this OPML file into feedly. It’s a list of all the Tableau and BI blogs I read.
Nicholas Bignell: Who are your favourite bloggers?
The Tableau blogging scene is huge (just check any month’s Best of Tableau Web roundups)
I’m more enthused by some of the amazing dataviz podcasts at the moment. Go check them out.
Suzanne Wilson: How do you define the relationship btw data, info, knowledge & intelligence?
I think there’s value in thinking of a wisdom funnel (this isn’t anything new – check out Google) but I have an aversion to funnels as metaphors: they suggest a linear process and a single direction. I’m more keen to think of data, info, knowledge and intelligence as part of a cycle of visual analysis. A bit of knowledge might make you seek out more data. More data gives you info, but only by sharing and acting with others do you get the intelligence
Anton Lokov: What is your favourite tool for rapid dataviz prototyping?
Why, Tableau Desktop, of course! But seriously, I don’t think anything is as good for exploring data quickly to prototype views.
Anil Mistry: Following on from Biel’s question, I am new to Tableau, are there any specific beginner books you’d reccomend?
A great new book is Storyelling With Data by Cole Nussbaumer. It covers the basics. I really enjoyed Information Dashboard Design by Stephen Few, it’s a fantastic introduction. For starting with Tableau, try Communicating Data With Tableau by Ben Jones.
Auzema Qureshi: What was/is the biggest challenge you have faced when using Tableau for data visulisation?
I remember doing a live “Analysts in the Hot Seat” at a Tableau conference in 2011. We were given a dataset, which we’d not seen before, and asked to explore it and build a dashboard in front of an audience. It wasn’t a great conference session. I spent 10 minutes semi-randomly dragging and dropping things around some worksheets, and duplicating lots of things. Then I realised that, uninspiring as it was to watch, this was actually EXACTLY why Tableau’s so amazing – I was throwing things around to see what stuck. What had so far felt embarrassing (“Really? This is how Andy Cotgreave plays with data?”) was actually the power of Tableau – drag, drop, fail fast, move on. After the 11th minute, all that exploration began to gel into something really powerful and I build a cool dashboard.
Recent Comments