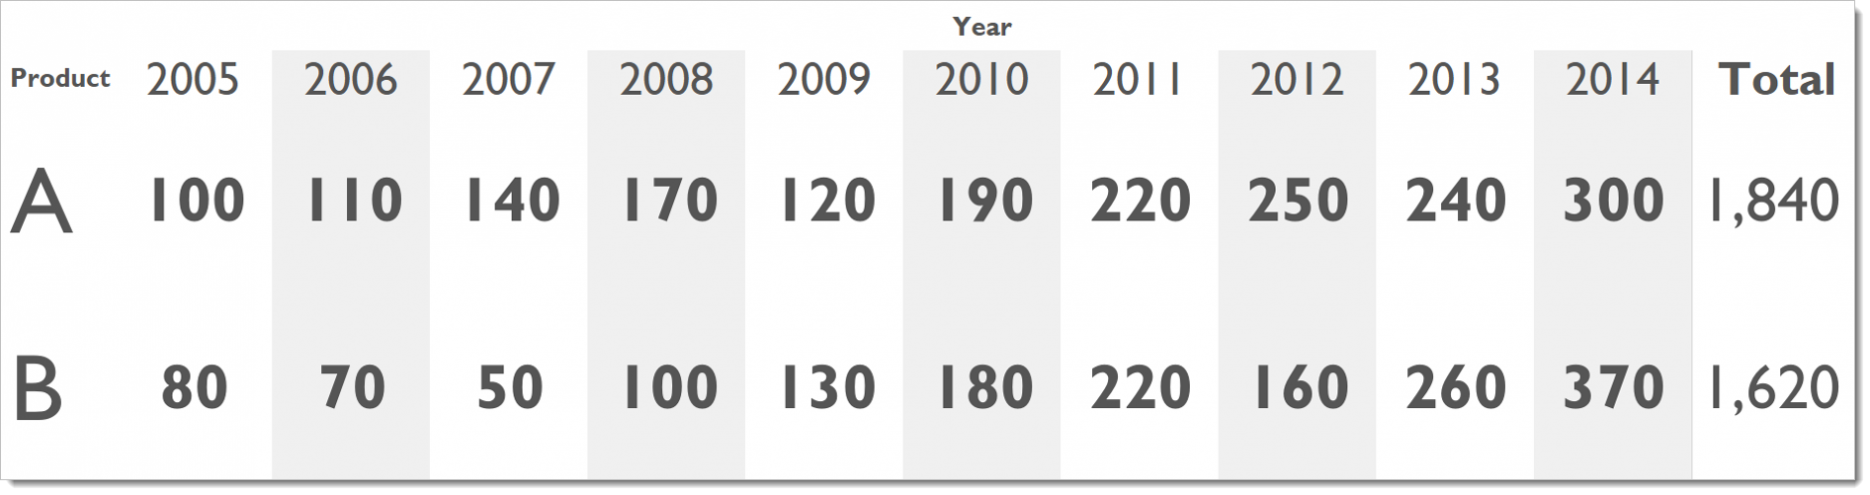
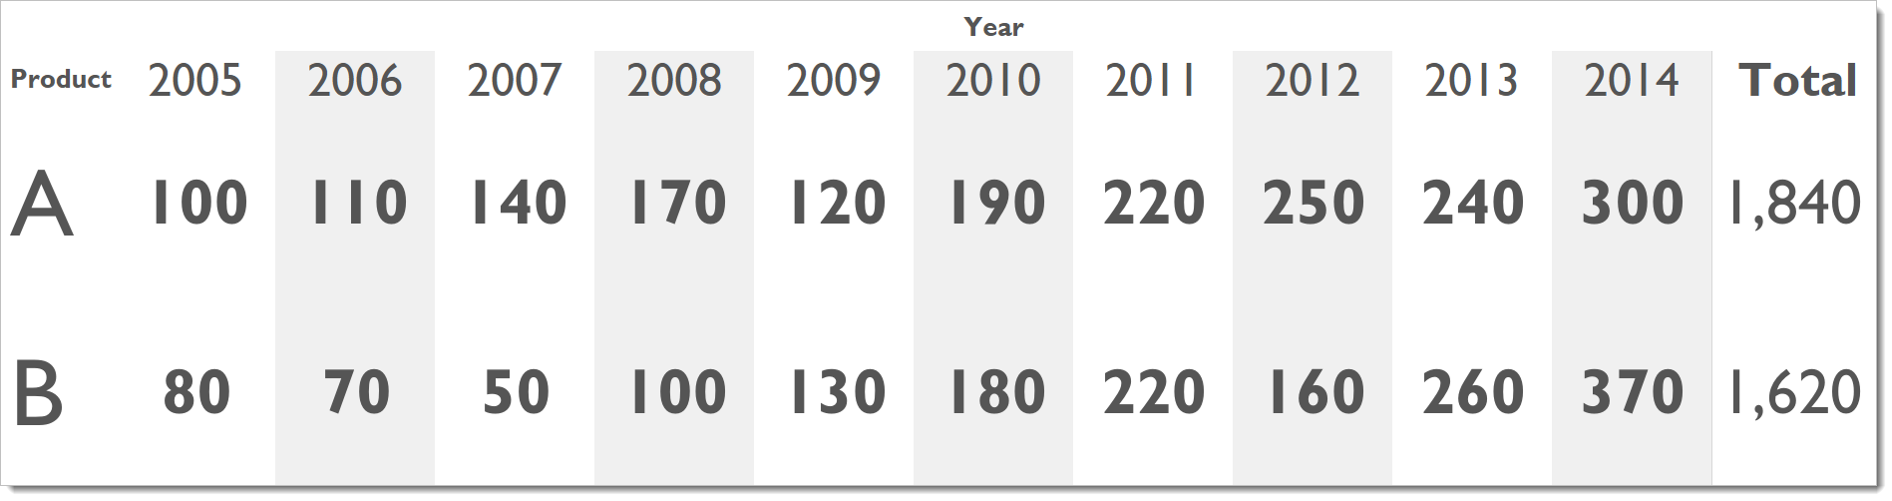
I’ve blogged before about there being no “correct” way to visualize a dataset. The video below shows how this is the case. Even when data is extremely simple, there are many ways to view it, each being better at answering a different question.
Conclusion? The trick isn’t to think “a line is the best way to show time data.” It’s to consider the question you want to answer. Manipulate and play with the data until the answer is clear.

2 Comments
Add Yours →Andy,
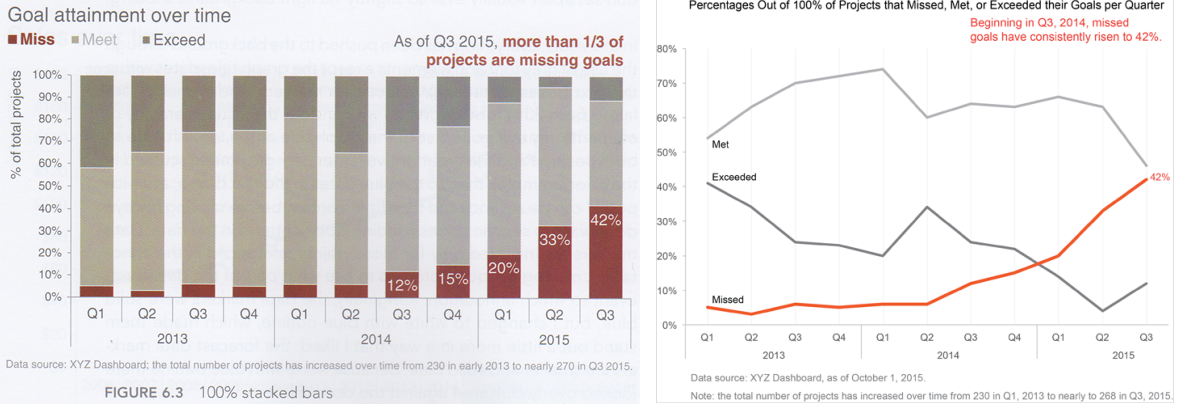
You have a real knack for taking ostensibly simple data sets and exposing the wealth of analytical possibilities. In this article I really liked the example of the side-by-side line chart (e.g. the small multiple slope) – it’s not something I would normally think to use but I absolutely see how it can quickly expose some useful insights.
-Mike
Nicely presented Andy – makes a compelling case for finding and using the presentation that conveys the salient point(s) one wishes to make.
This message needs to be conveyed, promoted, and reinforced, particularly in those environments where the prevailing paradigm is that there’s a canonical set of reports/dashboards/ etc that will be suitable for all of the analytical needs, which applies to business and BI/IT organizations still suffering the paradigm hangover of traditional Big BI.