Skip to the content Skip to the main menu

GravyAnecdote

Wherein Andy pours stories about data onto the web

  • Subscribe to my Sweet Spot newsletter
  • About Me
  • Home
  • Twitter
  • LinkedIn
  • RSS Feed

Wherein Andy pours stories about data onto the web

  • 100 Years Of Brinton
  • Arkham Horror Analytics
  • Big Book of Dashboards
  • Portfolio
  • Subscribe to my Sweet Spot newsletter
  • About Me
  • Buy data viz gear
  • Twitter
  • LinkedIn
  • RSS Feed

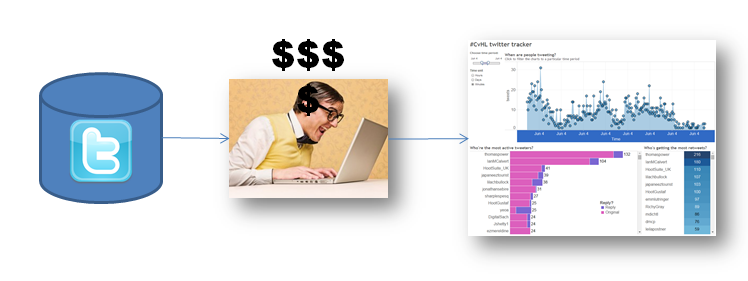
Using data pulled using Scraperwiki, Andy Cotgreave builds a dashboard that helps his team better understand the behavior of Twitter users – in 2 minutes and 42 seconds.

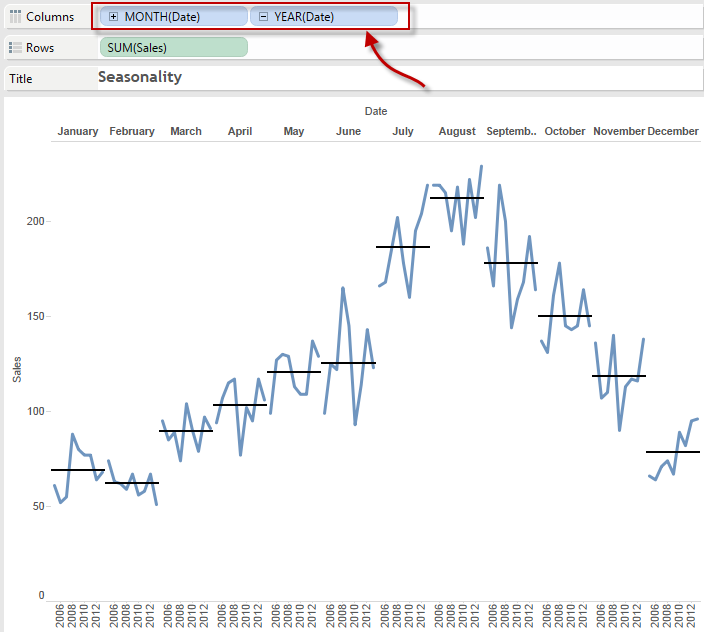
This video uses the DATEPARSE() function for super-fast date formatting. 

(Source: https://www.youtube.com/)

  • Post date
    December 9, 2013
  • Posted in Uncategorized
Previous post: I’m a Softwareentwickler (according to German TV!) Next post:

Leave a Reply Cancel reply

Related Posts

tumblr_inline_nmy6diiERg1sr3w0m_540.png

What’s the Daily Mail saying about the election?

  • Post date
    April 17, 2015
  • Comments
    0
thevizzes.png

SXSW: the most influential visualisations of all time

  • Post date
    March 8, 2014
  • Comments
    2
Fallback image

  • Post date
    May 1, 2015
  • Comments
    0
Fallback image

  • Post date
    December 17, 2013
  • Comments
    0

Theme by Anders Norén