Last week, Stephen Few critiqued lollipop charts and I wrote a post in their defense, in which I claimed I coined the term “lollipop chart” when I first wrote about them in 2011.
Stephen Few claims he’d seen them several times before I made them in Tableau. I accept that’s entirely reasonable. I remember at the time I thought my idea was original, and if I’d seen them prior to my post, I hadn’t consciously registered them.
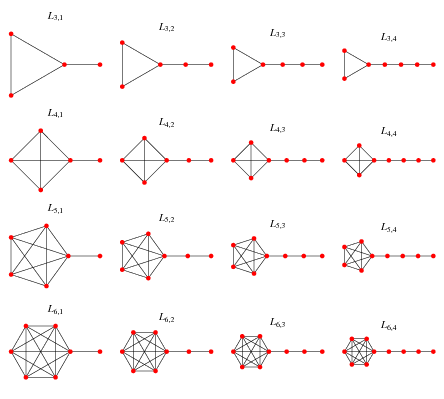
Stephen also sent me a link to the lollipop graph, on Wolprham Mathworld. One of his readers had googled the term lollipop chart back when I wrote my post. The purpose of the lollipop graph is different to that of the lollipop chart, but coining cutesy names is certainly not something exclusive to me (tadpole or barbell graph, anyone?
Which all renders my claim to inventing them hanging on by a thread! I probably wasn’t the first to make a lollipop chart. I wasn’t the first to come up with a cute name. Maybe, just maybe, I can claim the ever-shrinking privilege of coining the lollipop chart!


1 Comment
Add Yours →I still think you can claim the term “lollipop chart” or even “graph” as applied to a variation of the bar graph. Wolfram’s are structural displays.
You may not have invented the form itself, but you may have given it a catchy name.