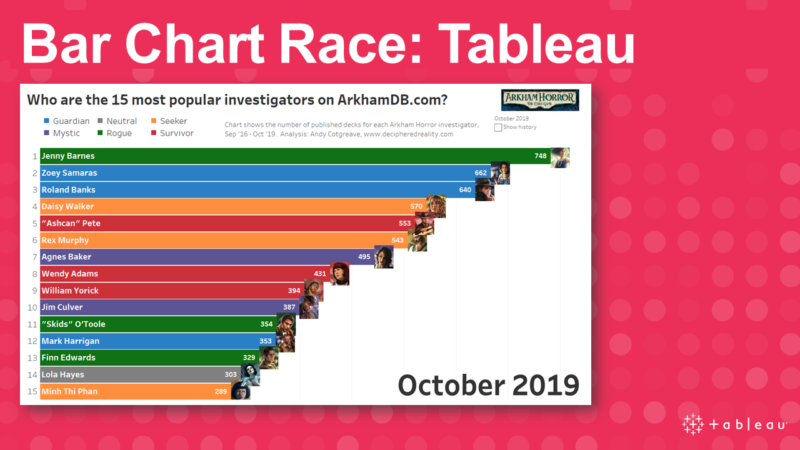
How to build a Bar Chart Race in Tableau (using the new animations features) Post date November 28, 2019 Comments 3
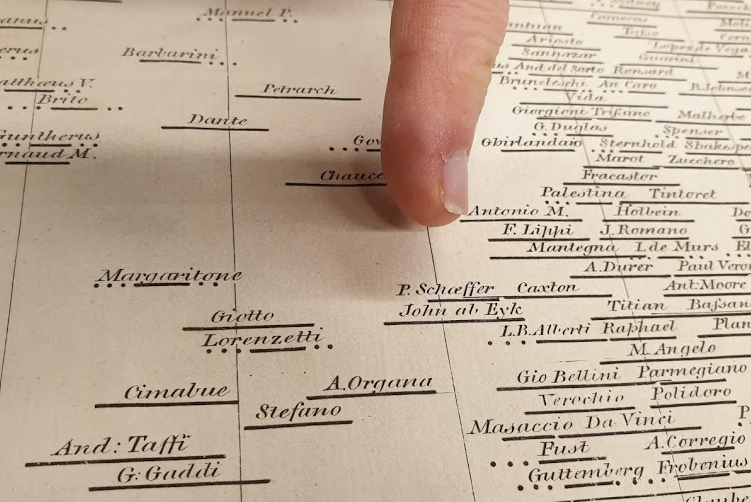
Historical data visualisations at Princeton, part 3: Chart of Biography Post date October 4, 2019 Comments 0
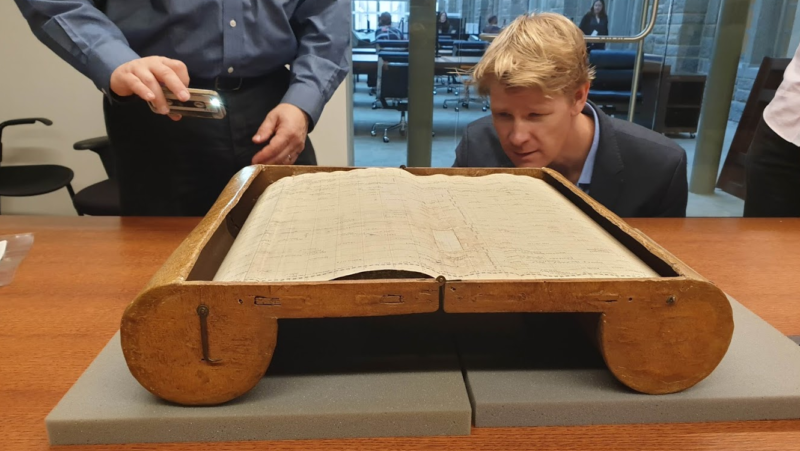
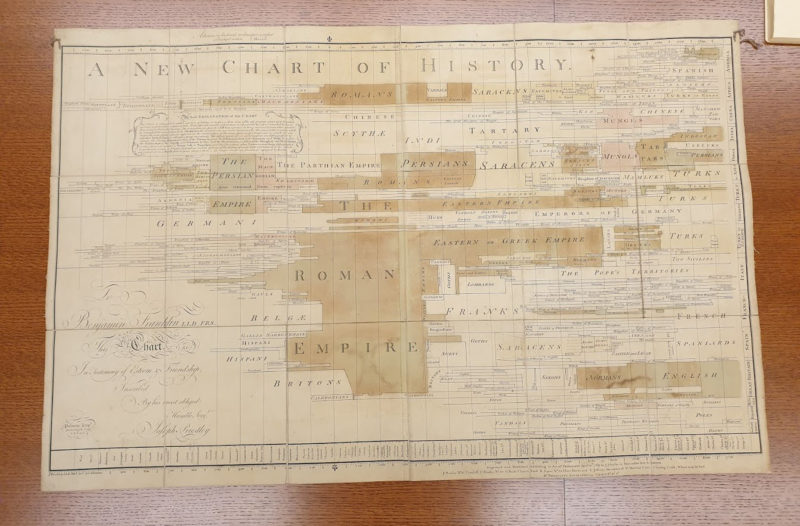
Historical data visualisations at Princeton, part 2: Priestley’s Chart of History Post date September 27, 2019 Comments 0
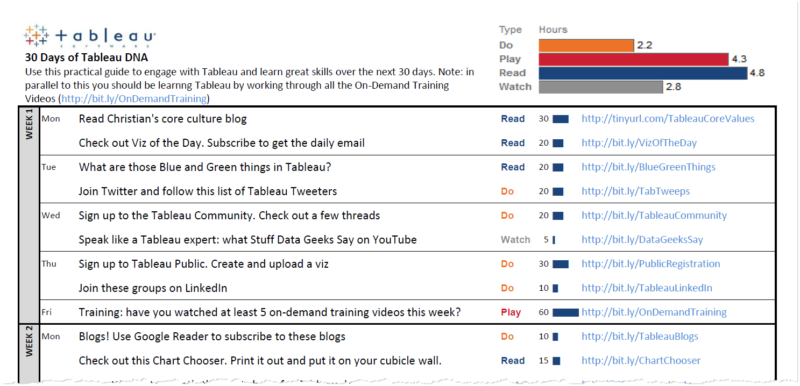
What are the 30 most important Tableau and dataviz resources? Post date September 23, 2019 Comments 0


Recent Comments