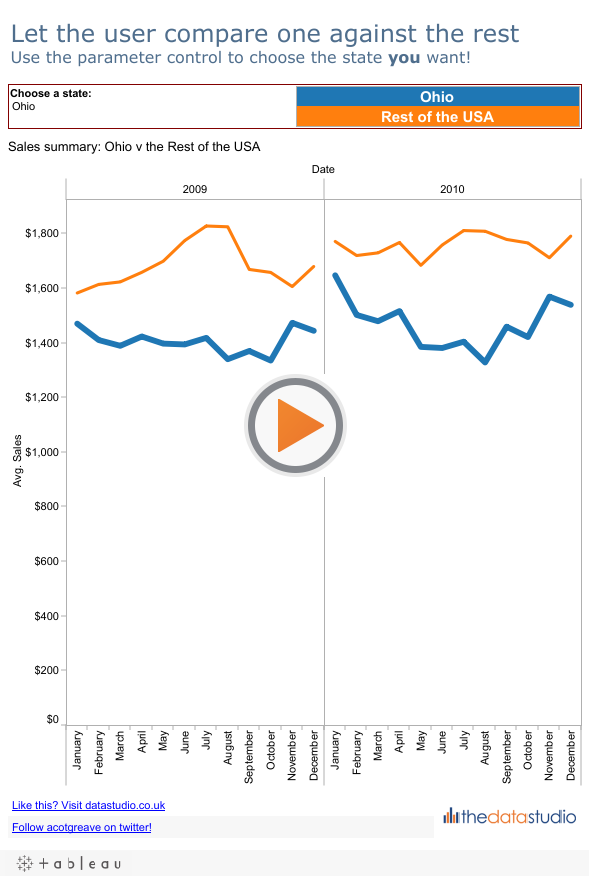
This is the third post on simple tricks that are available in version 6. This one represents a common request we get. The client says “I want to compare the performance of x against everyone else.” What is x? Well, it could be Customers, Departments, Countries, anything.
Parameters once again make this easy:
The drop-down filter is a parameter control, in this example showing every State in the Coffee Chain connection. The Tableau devs have made it easy to create a parameter containing every member of a Dimension. Right-click on the State Dimension, and choose Create Parameter…:
That’s your parameter list created – show the parameter control on your worksheet by right-clicking on the parameter and choosing Show parameter control.
Next up we create a calculated field to return either the State selected in the parameter, or all the others. This is essentially a dynamic Group, with one lone member of the Dimension, and everyone lumped together in the “Other” category. In this case, you can call the “Other” category anything you want. Here’s the calculated field:
This is the field you drop onto your worksheet. Whichever shelf it is on, it will only show two members: the State selected in the Parameter, and everyone else lumped together.


Recent Comments