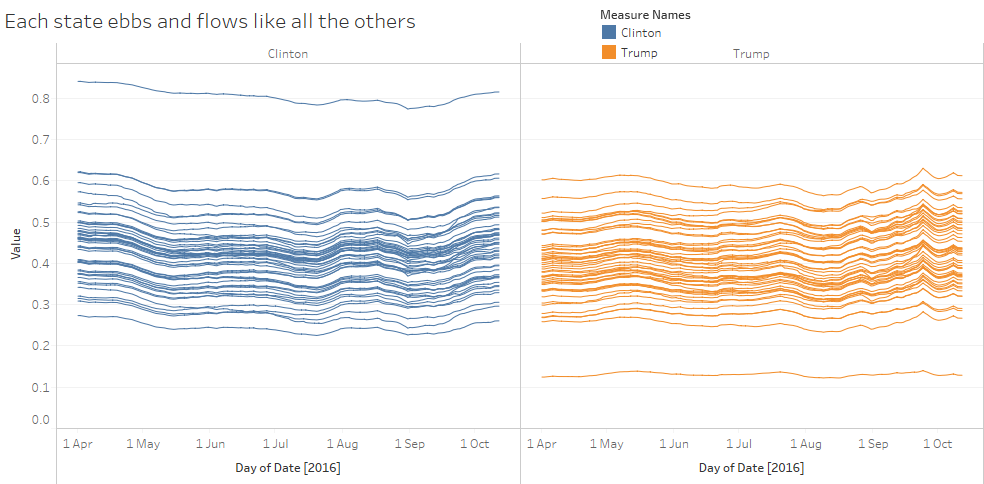
I got some real insight this week: all states ebb and flow for/against each candidate at pretty much the same pace. If that’s the case, why do the candidates pour resources into swing states, since all changes are reflected at the same level on the national scene?
This is reflected in the GIF below:

The US election is around the corner and this week we turned our attention to the polling data. We’d like to thank Drew Linzer for allowing us to use the data from the Daily Kos site.
My goal was this: how could you tell a story in a different way to all the poll trackers, without a map? I decided to drop the data on the independent candidates (sorry Johnson and Stein) and focus not on the actual polling percentage of Clinton and Trump, but the difference between their polling percentages. The gap is more interesting to me.
I goofed around with just making the chart of the gap, which was interesting. You can see that while Trump’s been in the lead a few times, he’s never pulled out a big gap, or held onto it for long.

Once I’d drawn that chart, it was then a simple case of adding State to the column shelf and realising that there was beauty and insight in the pulse of all 50 states. By adding the animation, I hope I’ve emphasised that all states go up and down at the same pace.
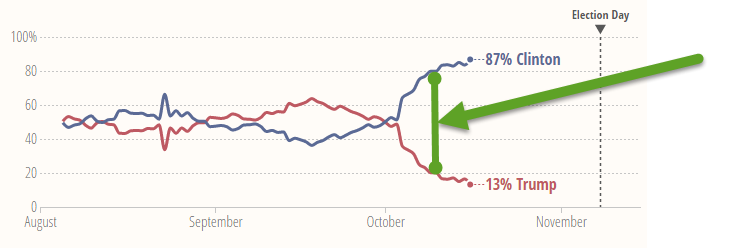
One thing, though – my chart is an elaborate way of showing the same thing as this line chart:
But where’s the fun in just doing a simple line chart? 🙂
I built an interactive version too.
The original
The Daily Kos tracker is great. There’s a challenge with poll trackers: how do you make them interesting? The Daily Kos tracker is pretty similar to the ones on FiveThirtyEight, HuffPo, WSJ, etc. The good news is that in this election, the data was volatile, so the trackers were interesting charts to look at.
As I wrote after the UK Election last year, the poll trackers used by the media were unsuccessful (in terms of drawing in audience) because the data didn’t change.
![]()
Recent Comments