(scroll down to see the slides)
 I gave a presentation at Oxford Geek Night #20 on Feb 9th. If you were there and have visited the blog because of that session, welcome and thanks for having a look around. If you are new to the blog, you can follow me on twitter (@acotgreave) to keep up with Tableau and Data Viz related things. Or you can subscribe to the blog’s RSS feed.
My session, Pie charts: good or evil, was intended to show people how poor pie charts are at represensting anything other than at-a-glance information. One could argue they fail even for that. This post is a collection of resources I used for the session, in case you want to do some further reading.
I didn’t get to cover some important points in the session. One common rebuttal to the argument is that you could add labels to the pie, showing the percentage. Well, yes, but that’s like admitting defeat. That is an acceptance that the chart alone does not convey the information correctly. If you need to label the slices, then surely you don’t even need the chart itself? And if that’s the case, then you’ve just proven to yourself that a ranked table of text is a better way to display the data, as shown below:

Wikipedia’s pie chart page now has a prominent section describing why the pie is bad.
I also recommend Jorge Camoes’ great blog. He eloquently describes the problems in at least two posts (this one, and this one, for starters).
For more on the specifics of the problems with Google Analytics, visit Coda Hale’s blog.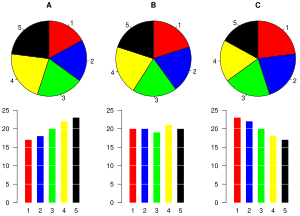
Stephen Few provides some in-depth analysis of the problems with all things circular (pdf). He also describes the significant problem with comparing relative sizes of pies, something I didn’t have time to touch upon in my session. There is a really great description of why size/area of circle is a poor choice at Contrast’s blog.
If you want to find some bad examples of pies, well, that’s like shooting fish in a barrel. Here’s just a few:
The Breakdown of the blogosphere. Six variations on the pie chart. None of them any use. EagerEyes features this infographic in his excellent March Chart Madness post.
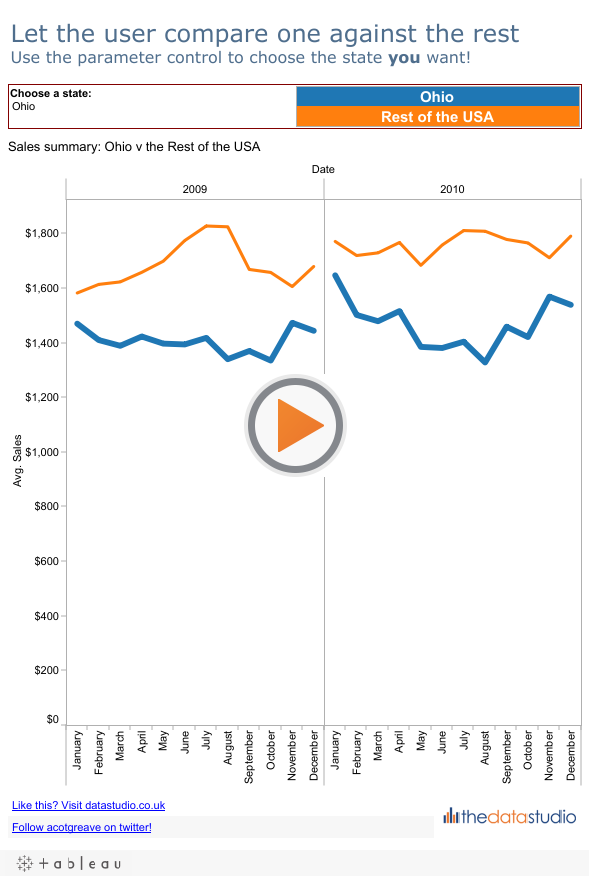
I did mention there are some reasons a pie might be a good option. There are at least a couple. If you specifcally need to compare several dimension members against other dimension members, a bar chart doesn’t make that easy. If your pie chart is going to seen for a short period of time, such as during a presentation, and it only has a 3 or fewer slices, then a pie can make a point quickly. In this latter case, don’t put the pie in the handouts – give the user more info with a table or bar chart.
Finally, here are my slides. I’m not sure how useful they are without my words, mind:

1 Comment
Add Yours →Very nice pie presentation Andy.