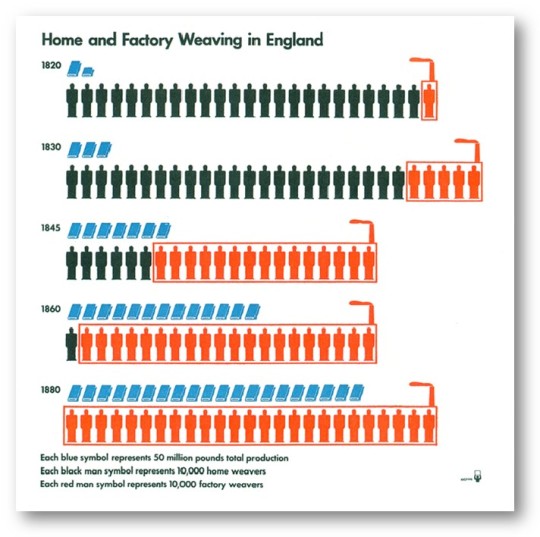
Brinton was ahead of his time. In designing the chart above, he wanted to acknowledge the engaging power of illustration but preserve accuracy.
If you’ve seen charts like this before, it’s because they are almost identical to the Isotype “pioneered” in the 1930s by Otto Neurath.
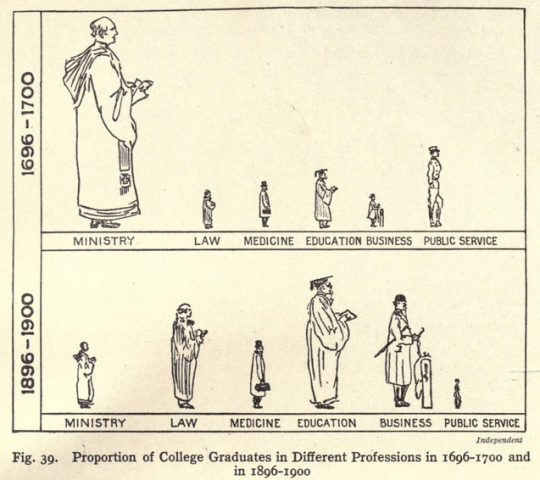
Brinton’s motivation was to avoid these kinds of pitfalls:


1 Comment
Add Yours →He was aware of Neurath and vice versa. One of the books on the subject says they had exchanged letters. Neurath was influenced by Europeans practicing similar concepts going all the way back to Hieroglyphics, so I do not think the influence went from Brinton to Neurath. That said, Scientific American had many pictograms going back into the late 1900s, so they were around by the time of Brinton’s book.