At Tableau, we’ve just launched a Data+Music campaign, and the latest Iron Viz feeder is all about music. What if you looked at your own music listening habits? I did just that, and hopefully it might inspire your own explorations. In first post in this series, I showed how you can begin collecting your data. Go check it out if you haven’t yet.
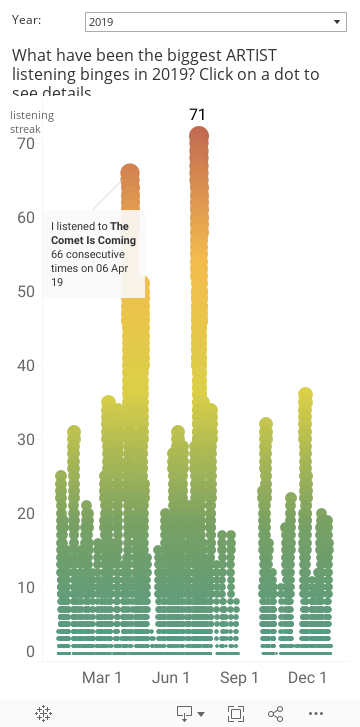
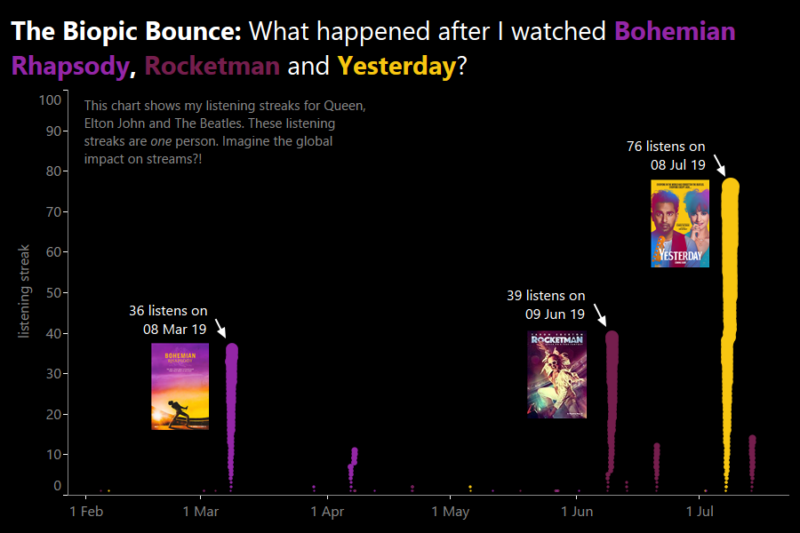
In this post, I wanted to look at listening binges. Check out my binge listening analysis for 2019:
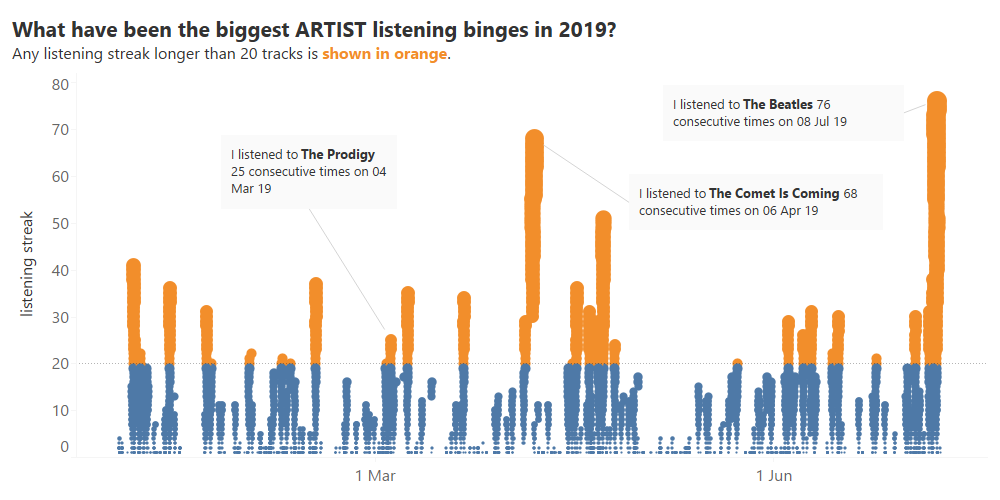
My biggest listening binge is The Beatles (I went to see the movie Yesterday last week and that led to an entire weekend of The Beatles on the stereo. Second biggest is The Comet Is Coming. I listened to them, and nothing else, 68 times in April. Check out these super jazz/electronic/psych rock band:
I highlighted a smaller listening binge with the Prodigy – I spent a day listening to them after the sad death of Keith Flint in March.
Click here to explore an interactive version which shows my binges over the last 10 years.
I love this binge chart: it contains Tableau history
Why do I love this chart? It’s based on a viz I built wayyyy back in 2011, when I looked at commuting in the rain. I was asking the question “How long does it go without raining on my commute?” Check out this retro viz (click to interact with it):
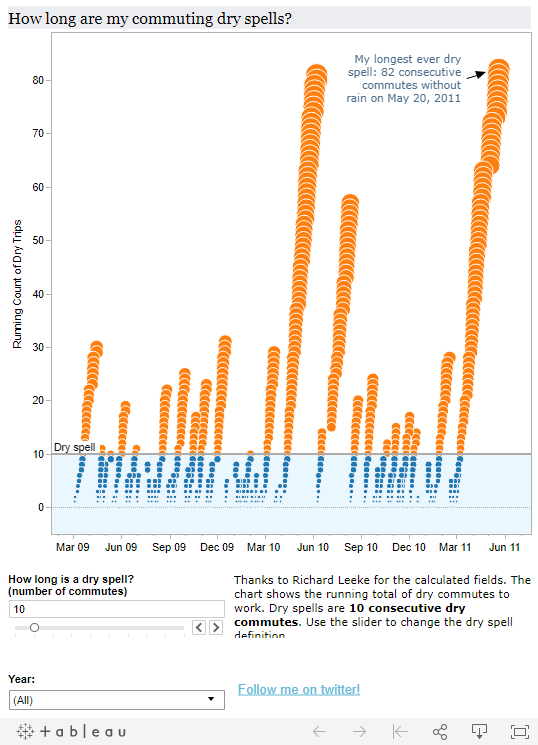
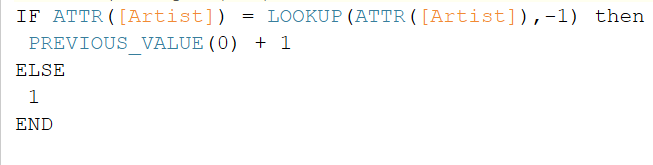
That calculations to do this was developed with Richard Leeke and Joe Mako, two of the early pioneers of the Tableau community. I’m very fond of those times and it’s great to reuse this technique. It hinges around this great calc, written by Richard, that uses LOOKUP and PREVIOUS_VALUE to create a running sum if a value is repeated.
What artists do you binge listen to? If this has given you some ideas for your own analysis go check out how you can start tracking your digital listening, or get hold of 3 months of your Spotify data near-instantly by reading the first post in this series.
You can interact and download my workbook from Tableau Public by clicking here.

Recent Comments