
This is a story of how a small seed in my head became the winning entry in Tableau’s internal “Make some are for our walls” competition. The creation of the Kraken entry was one of those experiences where I was driven by an idea. Along the way, I made new friends, discovered new stuff about Tableau, and was helped by serendipitous Google searches.
The seed
At Tableau, on our Product Consultant mailing alias, people occasionally mail out a “PC Challenge.” It will be some sort of edge case that’s been encountered and solved by the sender. The solution comes later, once people have engaged. I sowed my own seed for the Kraken with my “Pies on Scatter Plots” challenge. Can you put a pie chart on a scatter plot? Don’t worry about the question of whether you ever should put a pie on a scatter plot!
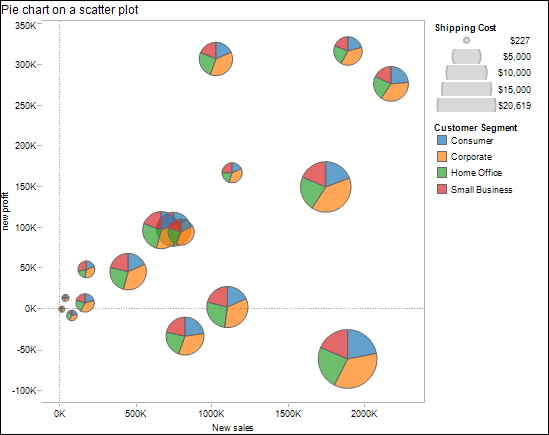
Feel free to work out how to do this. If not, just go download the workbook. It involves Table Calcs on the X/Y axis or blending. Why we can do pies on maps but not scatterplots is one of those great Tableau mysteries.
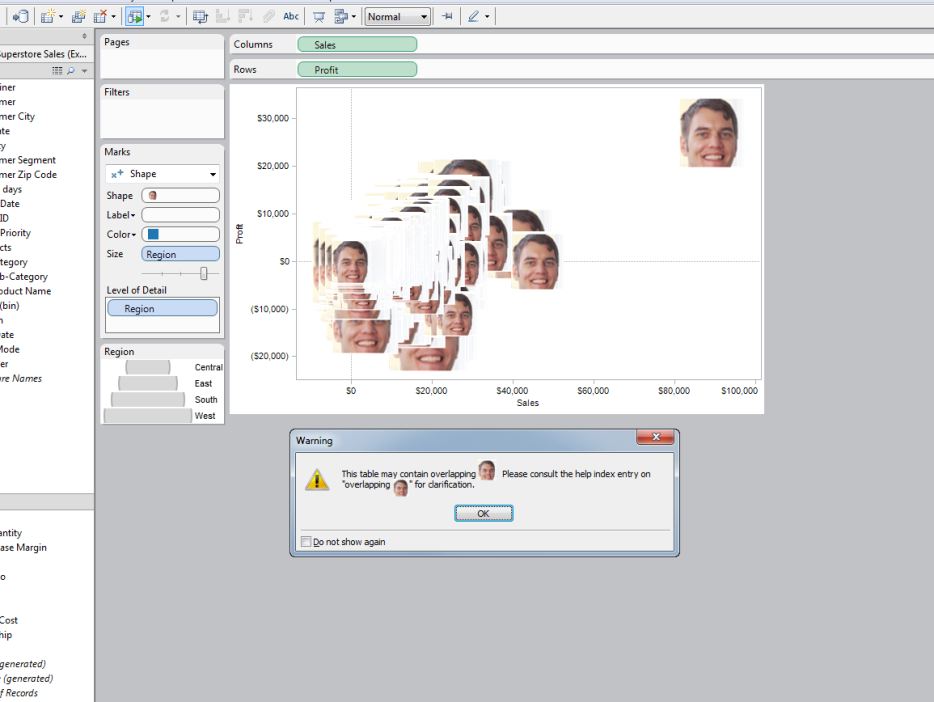
I sent the mail and the thread was a great one. Lots of people attempted the challenge. Some got it right, and eventually it descended into chaos. For example, this was one solution:
It was Aaron Clancy’s Cut and Paste hack job that was the seed for this whole project. He sent this to the email group:
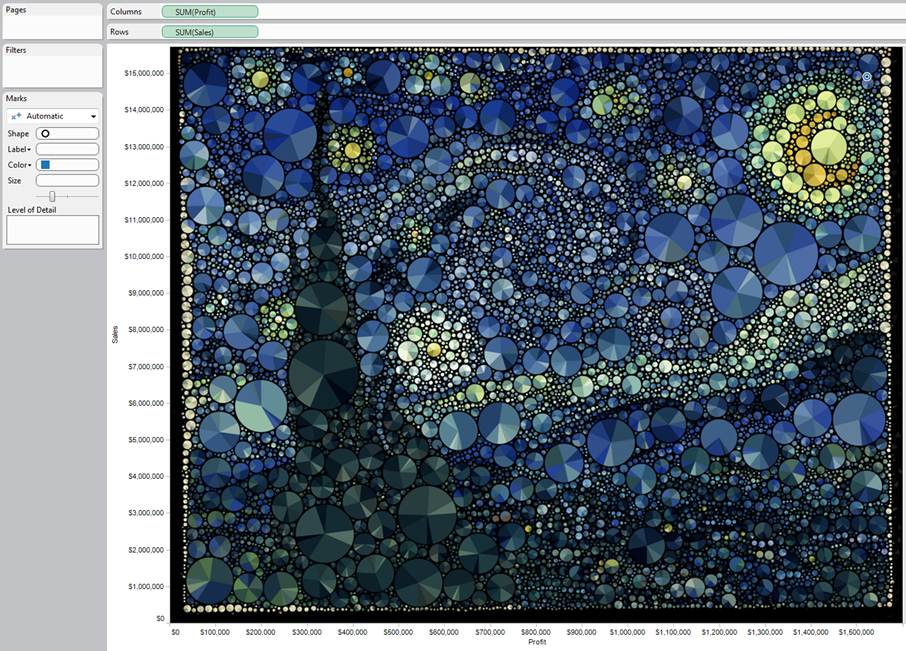
Wow! That’s Starry Night by Van Gogh encoded by into pie charts.
And so the seed was sown. “I will make that chart” was now in my mental to-do list.
The germination
That seed lay dormant until watered by an email a couple of weeks later. “Hey Tableau, we have new offices with empty walls. They need art on them.” That was all I needed to get going.
The hunt
But how would I begin? Well – Google the Van Gogh circles image in order find its source. This led me to Quasimondo’s page on Flickr. This was the origin. I sent Quasimondo an email and got a vague promise to share the data, but, alas, this never materialised.
Undeterred, I dug around to find the community of people who were into this packed circle drawing stuff. All roads led to flickr user TinRocket. And then to his site, TinRocket.com, run by John Baliestrieri. You need to go visit his site. He does better image processing than anyone or anything I have ever seen. His instant comic book effects are breathtaking. But I was after his packed circle data. This treasure lay in Percolator, John’s amazing iPad image processing app.

I paid up and downloaded the app, ready to get data and make a viz.
But, oh no: John’s app didn’t allow me to export the data. I was stumped. By now, though, I was driven. This project was going to work, come what may. I contacted John via flickr, and within an hour, I’m Skyping him in New York (I’m in the UK). We had a chat, and John’s enthused. So much so, he offers to build me a custom version of Percolator that will export the data. What? John B, contacted by some random geek in the UK, enjoys an idea so much he’ll dedicate time to creating a one-off version of the app just to allow me to complete this project? Amazing.
Three days later, I have Andy’s Special Percolator exclusively made for my iPad. The image in and, on my iPad, the data comes out. But which images? I processed Van Gogh’s starry night, plus a whole bunch of others. These included Rothko’s Red On Maroon (incidentally, I proposed to my wife in front of that painting), some Tableau-related photos, and photos of my village’s windmill. Van Goghs’s image would give me the kudos I sought in the PC Challenge, but none of these were good enough to win the art competition (by now I knew I was onto something cool, and I wanted a great entry for the competition).
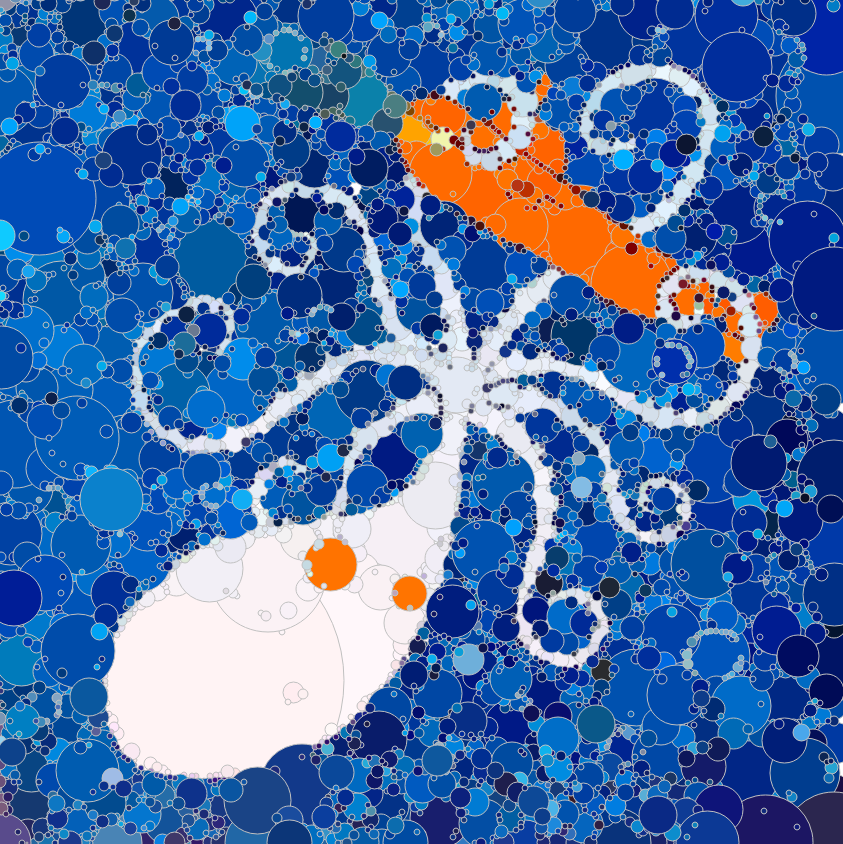
What image would engage my colleagues? Why, a kraken, of course. Our most recent version of Tableau, version 8, had the internal code name Kraken. Off to Google again to find an image I could use. Go and Google Kraken images – lots of amazing, fantastical pictures reveal themselves. But they weren’t appropriate. I scrolled through page after page before finding this:

Perfect! And now you need to take a break to visit Macula.TV. It turns out Chris Bonnette is a great artist who loves to draw illustrations of mythical monsters. But I can’t just steal someone’s image for the competition.I mailed Chris and he was generous enough to let me use the Kraken for our competition. I am very grateful to him for this.
That’s the end of part one. I have a tool for making data. And I have some great images, including the kraken. The next part of the story is all about Tableau and how to draw 5,000 circles in a pleasing way. Click here to read part 2.

3 Comments
Add Yours →Andy,
This is one of the coolest Tableau applications I’ve ever seen. It was fun to read and I learned a bunch. The artwork is very, very cool.
Thanks!
Ken
Hi Ken
Thanks for the kind words – I’m really glad you enjoyed it.
Best wishes
Andy
Hello. I would like to learn how to make pie charts on scatter plots. There is no workbook to download here to learn.