
Check out this chart. Admire its design before you read what it’s showing.
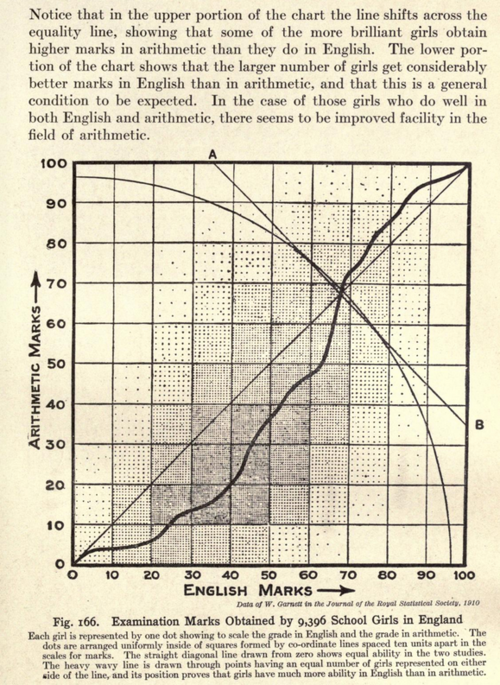
It’s a scatterplot. But not quite. Instead of simply showing each mark in its exact spot, the chart has been divided into a grid and the dots distributed evenly. It’s like a scatterplot heatmap.
I’m posting this one today because it had always struck me as an interesting technique but not one I have seen. And then, what do you know, up pops a great blog post by Stephen Wexler describing how to do something similar with survey data.
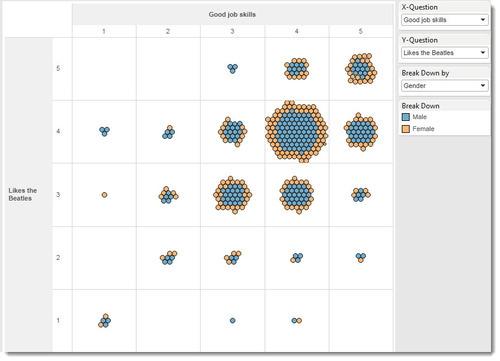
(Steve’s clustered scatter)
I suspect Brinton’s chart design was originally chosen because doing Ben Day work would have been easier than individually plotting each mark.
The subject matter of the chart, of course, reflects cultural changes. It shows scores in English and Maths tests for girls. Brinton says that it’s demonstration that girls are better at English “is to be expected.” Hmm. Fortunately many things have changed for the better since 1914.
:


Recent Comments