
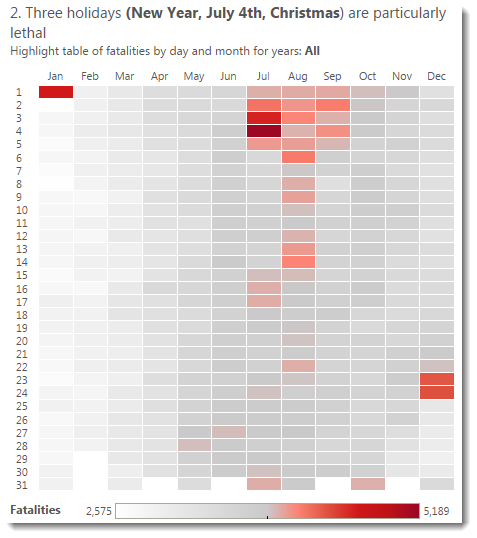
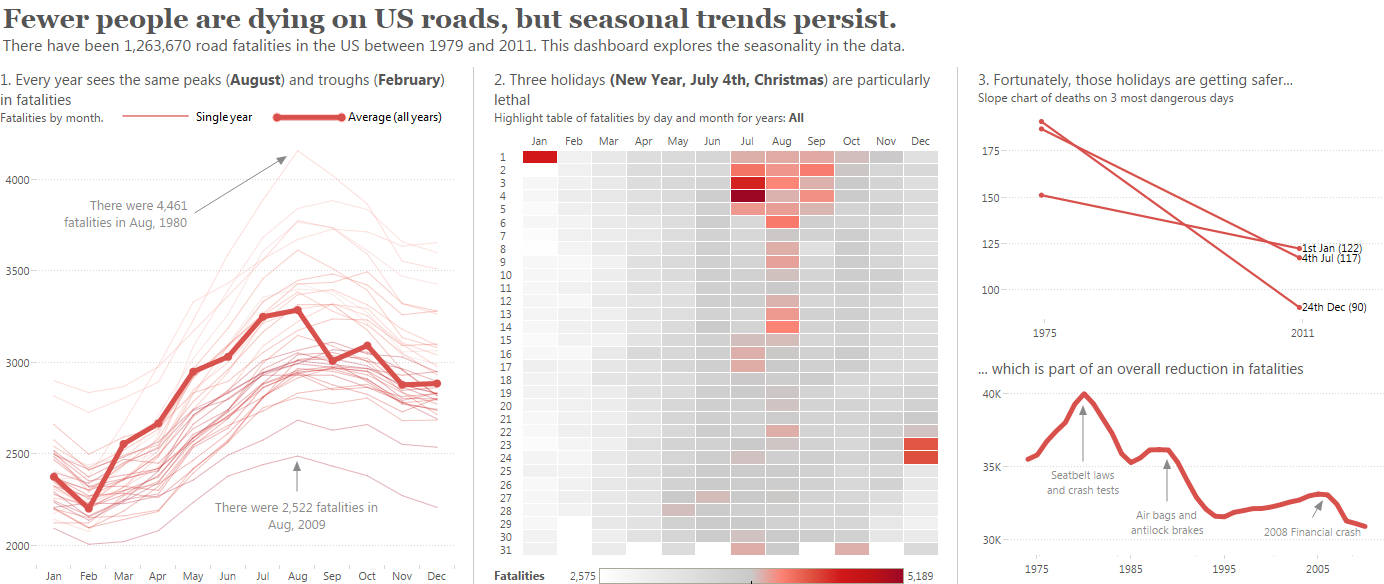
The highlight table above has white borders around each mark. Why did I make this change to the defaults?
Tableau’s default mark border is None. in this post I will explain why I often find myself changing the defaults. Here’s what the chart looks like with the default border setting:
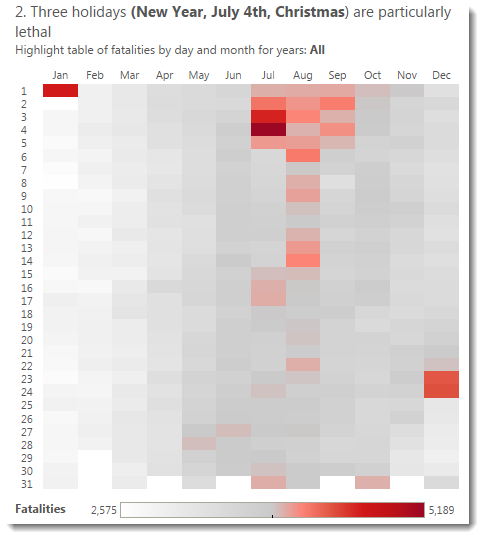
As I mentioned in my first post about these charts, there’s nothing inherently wrong with having no border. It largely comes down to personal intuition. I think that changing the border to white brings the marks into more focus.
What do you think? Is my highlight table improved by using white borders?
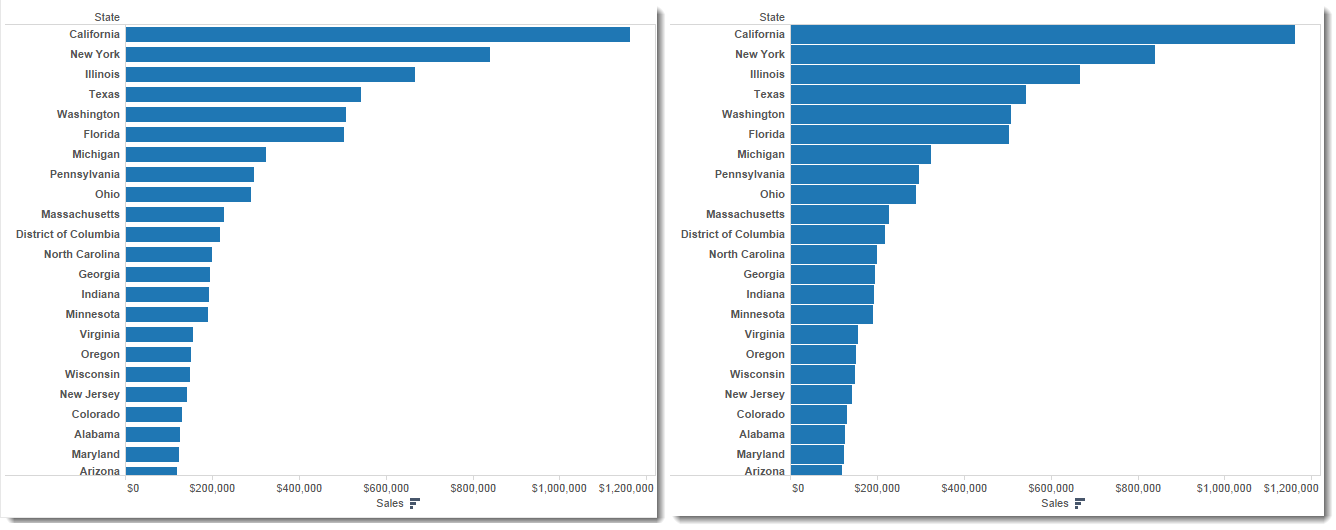
I use this technique at other times with Tableau. I wrote about this when sharing my lollipop chart idea back in March 2011. I sometimes feel our default sizing, with gaps between the bars, creates something of a moire effect. This can be solved by upping the mark size to maximum and adding a white border to the marks:
Should you add borders to your marks at all times? No. Should you add them sometimes? Yes. How should you decide? The good news is that it is so easy to do this in Tableau you can easily try it with our without borders and go with how you feel.
Borders don’t apply just to marks. Should you add them to your legends too? I will leave that question and discussion to Jeffrey Shaffer and his excellent post on borders on legends.
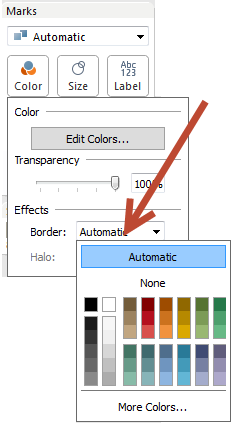
All you need to do is change this section on the Mark Shelf:
Try it out on your charts – do they look better with mark borders? Borders can potentially enhance all your chart types.


2 Comments
Add Yours →Hi Andy,
I often place borders around marks, as you have. I also place borders around sections of a dashboard (via containers) to not only visually group related items together, but to keep the dashboard elements from appearing to just float there on the screen, untethered. It’s a clean and simple way to direct the eye and keep it focused on the charts vs. wandering off into the sometimes large amount of whitespace (depending on the size of the monitor).
-Mike
Thanks for the recommendation, Andy. I just did this for a project I’m working on and it helped remove some ambiguity in how the data was being presented.