Oh I was torn this week. Here’s the orginal article.
This was my first makeover:

In fact, I constructed the whole of this post about the chart above. As I wrote the final comment “but I didn’t actually think the original was too bad” I thought, maybe I’d just go back and build the original one in Tableau. Soon I came up with this:
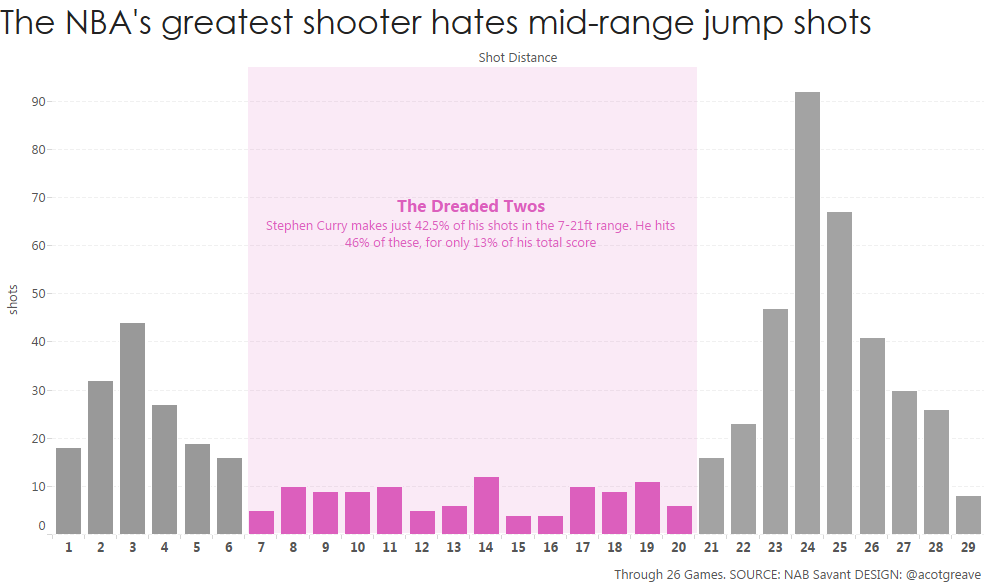
I prefer it to my original makeover. So this week’s submission. is really nothing more than a format change. Why do I like the reformatted one over the redesigned version?
- There’s lots of detail in the histogram behind the obvious annotation and colour messaging
- The shading highlights the Dreaded-Twos distances. The point of the article the chart is from was about the dreaded-twos, but the original chart didn’t call out those distances well enough.
Regarding the first makeover (the one at the top of this post), here’s the notes I made:
Let me confess: I’m not too happy with the outcome of this one. However, here’s what I was trying to acheive in this week’s makeover:
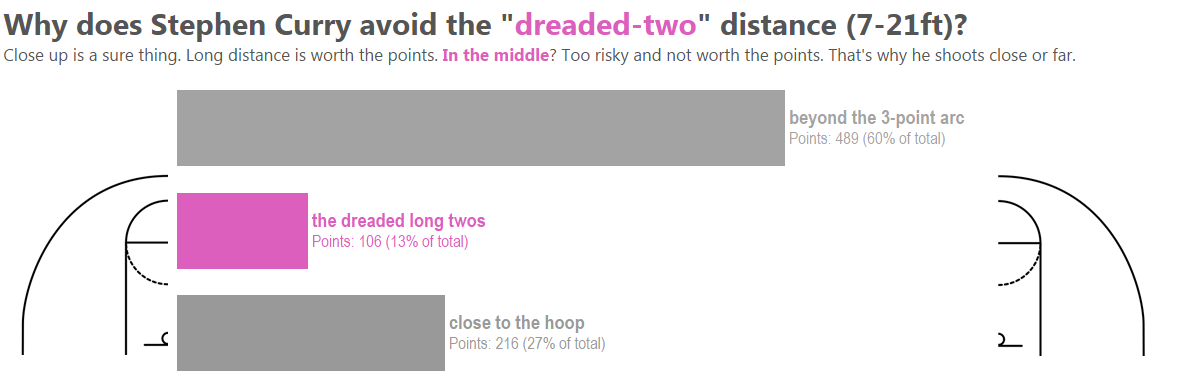
- The original story focussed on the fact that Stephen Curry shoots from close or far, not from “the dreaded twos” distance of 7-21ft.
- The original chart didn’t group his shots into the three categories, which was what I felt was wrong. If the article’s about those three distances, then why not emphasise that aspect and group things together.
- I also wanted to emphasise the points value. It’s not just about shooting from 18 feet or 22 feet, for example. The decision is also about points. The original chart doesn’t show the points value.
- I tried to incorporate a basketball arc into the diagram to visually show where each group sits.
- I probably messed around with colour more than anything else. I settled on the purple for the dreaded-twos and found that incorporating that colour into the title and subtitle helps decode the chart.
- I did consider pie charts, as they do show part-to-whole very well but with this data, they didn’t come out well enough.
- The original chart on Business Insider wasn’t fundamentally flawed this week, it only needed a few small tweaks to make it better. [hence the final version at the top – Andy]
- With more time, I would have more fully incorporated the metaphor of the baseball pitch graphic.
What does this prove about makeovers?
- Don’t reinvent the wheel if the wheel wasn’t too bad in the first place.
- Iteration is vital. Iteration is always vital. Sometimes you need to go off on a tangent to realise you were in a good place to begin with.

1 Comment
Add Yours →Hi Andy,
Thanks for the information. I want to know how to group data in Tableau. Specific to this problem, the shot distances are in the least count of 0.1 m. If I want to club together(like you have done), so that all the shot distances are integers? for example:
shot distances 0.4,0.7, 0.9 should be in the group 1m
shot distances 12.1 , 12.5, 12.7 should be in the group 13m
Now my question:
1. I know that we can do this by right-click on the dimension, and manually selecting each shot distance and then grouping them. Is there any way to automate this? Like selecting a option which automatically combines the 0.1 least count numbers to their respective floor, or ceiling count.
Thanks