
I had one goal this week: could I show all the measures in the space the orginal scorecard shows two?
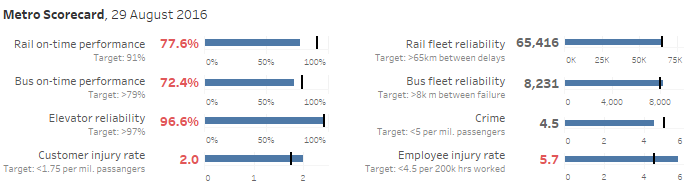
The answer? Yes, and not just by using 6pt fonts!
Bullets are an easy way to see actual against a target, and they take up way less space than curvy bar charts. Missed targets are encoded twice: the bar is below the target reference line and the label is red.
One thing I don’t like about my approach is the arbitrary axis lengths. Some of the metrics are percentages, so you can set the axis range from 0-100%. That way the viewer can see three things:
- The actual value
- The distance from the target value
- How close actual/target are from perfection.
Where the metrics are values, how should you set the axis range? Look at the charts on the right hand side. They are all very different scales. Should I let the chart tool set the range automatically? If I do that, the bar or reference line will be right at the right hand edge of the view. Or should I artificially extend the axis, creating a nicer sense of white space?
The original
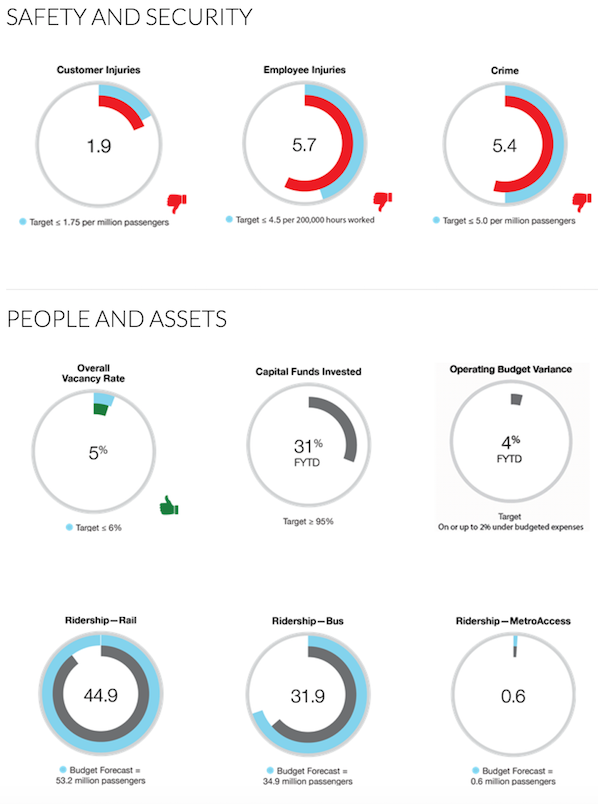
There’s lots to like about the original:
- There’s a thumbs up/thumbs down for good/bad performance. That makes it easy to identify which metrics are being met.
- The actual value is labelled in the centre of the circle.
- The targets are defined in text
The main thing to dislike is the curvy bars. They don’t add anything, other than a sense of colour and false excitement. Really, to fix this scorecard, all they’d need to do would be to flatten out the bars and shrink the layout.
[Note: the original was updated to fix an error in the color encoding of my makeover. Thanks to Clibo for pointing it out.]
Recent Comments