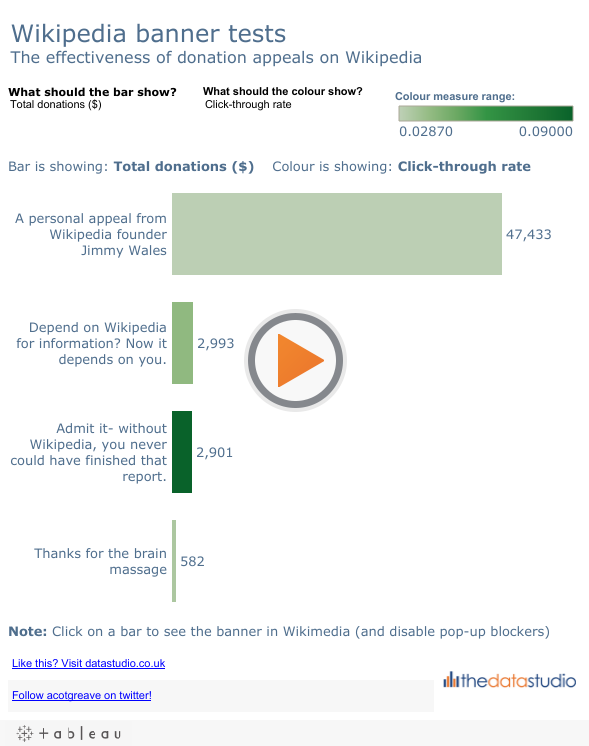
One can always expect visually attractive stuff from David McCandless on his Information is Beautiful blog. Sometimes though, the visual displays potentially confuse viewers. Today’s great post on Wikipedia Banner Tests is an example. Representing the size of donations using a square is pretty, for sure. However, we tend to perceive the relationship of one area to another pretty badly. A linear representation is more effective:
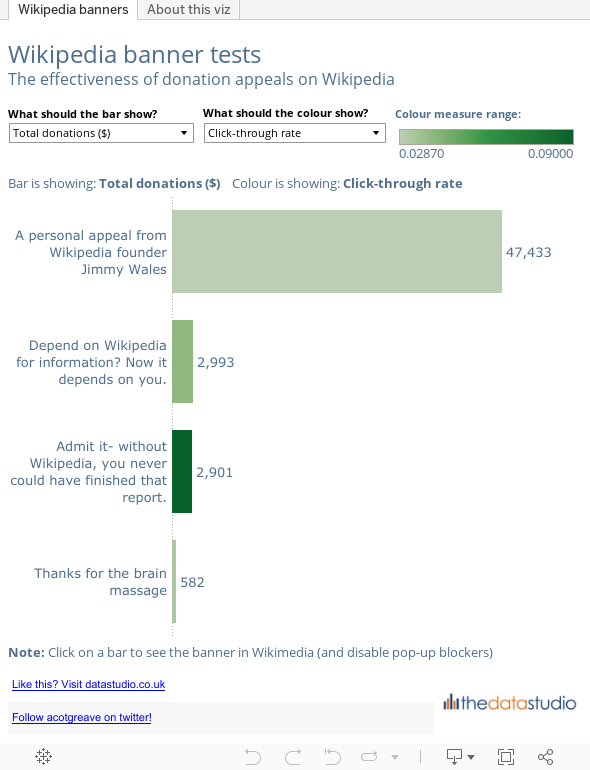
Think back to David’s orginal squares view – would you really have guessed that the Jimmy Appeal raised fifteen times much cash? If so, you’re one of the few – most people would have said it was around 8-10 times larger. The linear view above makes that difference much more clear.
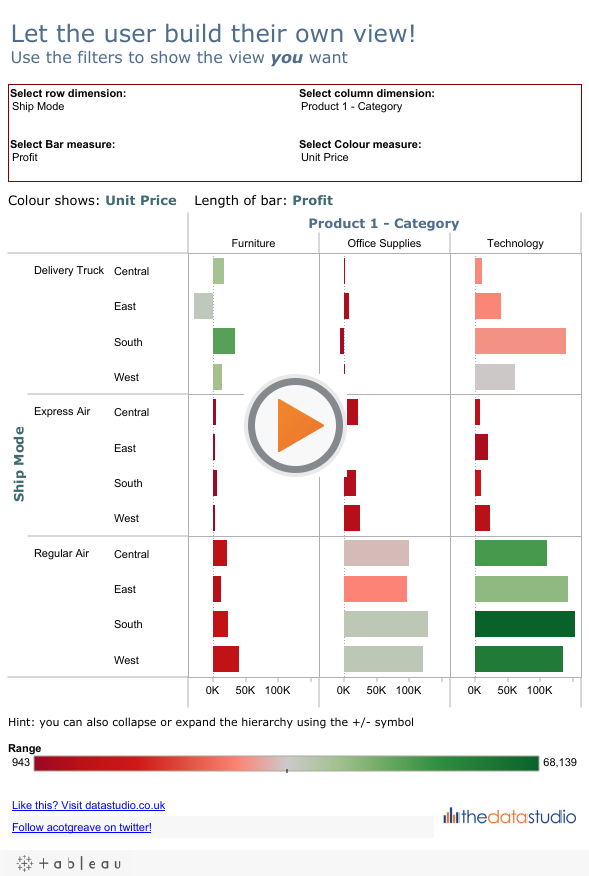
There’s also some interactivity on my view – you can change the measures being displayed in order to explore the data a little more.
Enjoy!

2 Comments
Add Yours →I did a comment like that some months ago, but people (and in this case the great David McCandless) keep representing one dimension data with 2 dimension drawings: areas. I guess it is just because squares and areas loss nicer!
I is even worse when instead of rounded squares they use circles!
Thanks Andy – I remembered pablo’s comment and wanted to do exactly what you did – to post a comparison with linear comparison.
Though I wanted to make it with 1 dimensional lines, not thick bars – you can arrange it such way that they are very close to each other – for example one line of text underlined with the linear representation of it’s impact.
Or the bar can be overlayed on the line of text – I saw something like that in a computer magazine, where numerical representations of various attributes of for example various graphic cards were shown in a table – the attributes were in fixed width columns, each number overlayed with a pastel color bar, the width of which represented percentage of the maximal value in the given column.